 29
29peptides
spectra
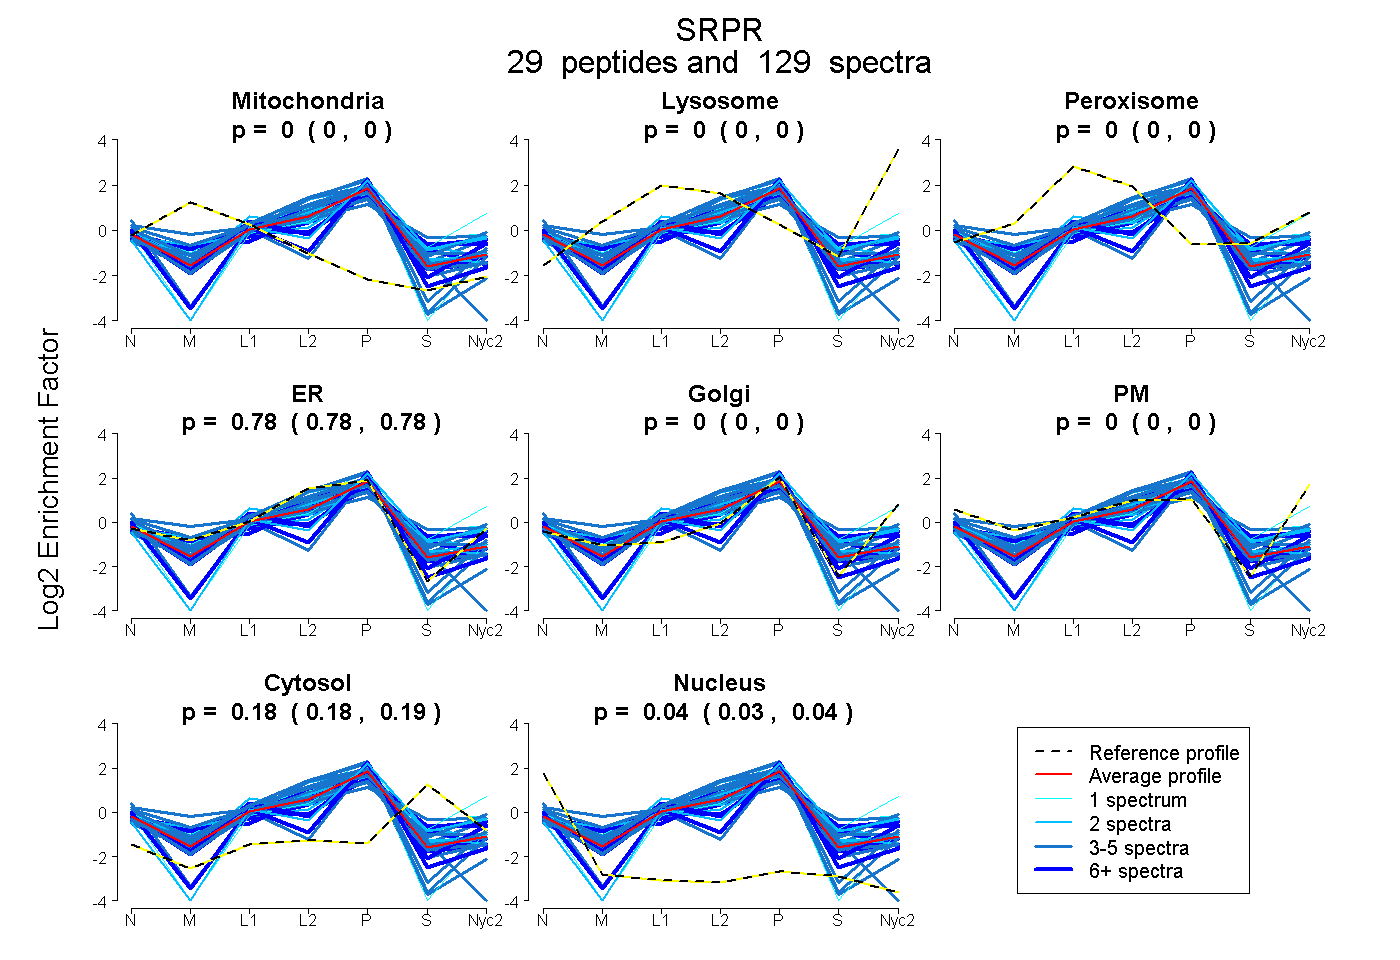
0.000 | 0.000
0.000 | 0.000
0.000 | 0.000
0.778 | 0.784
0.000 | 0.000
0.000 | 0.000
0.177 | 0.186
0.034 | 0.040
16peptides
spectra

0.000 | 0.000
0.049 | 0.073
0.787 | 0.818
0.000 | 0.000
0.004 | 0.031
0.107 | 0.124
0.000 | 0.000
27peptides
spectra

0.000 | 0.000
1.000 | 1.000
8peptides
spectra

0.000 | 0.000
1.000 | 1.000