 7
7peptides
spectra
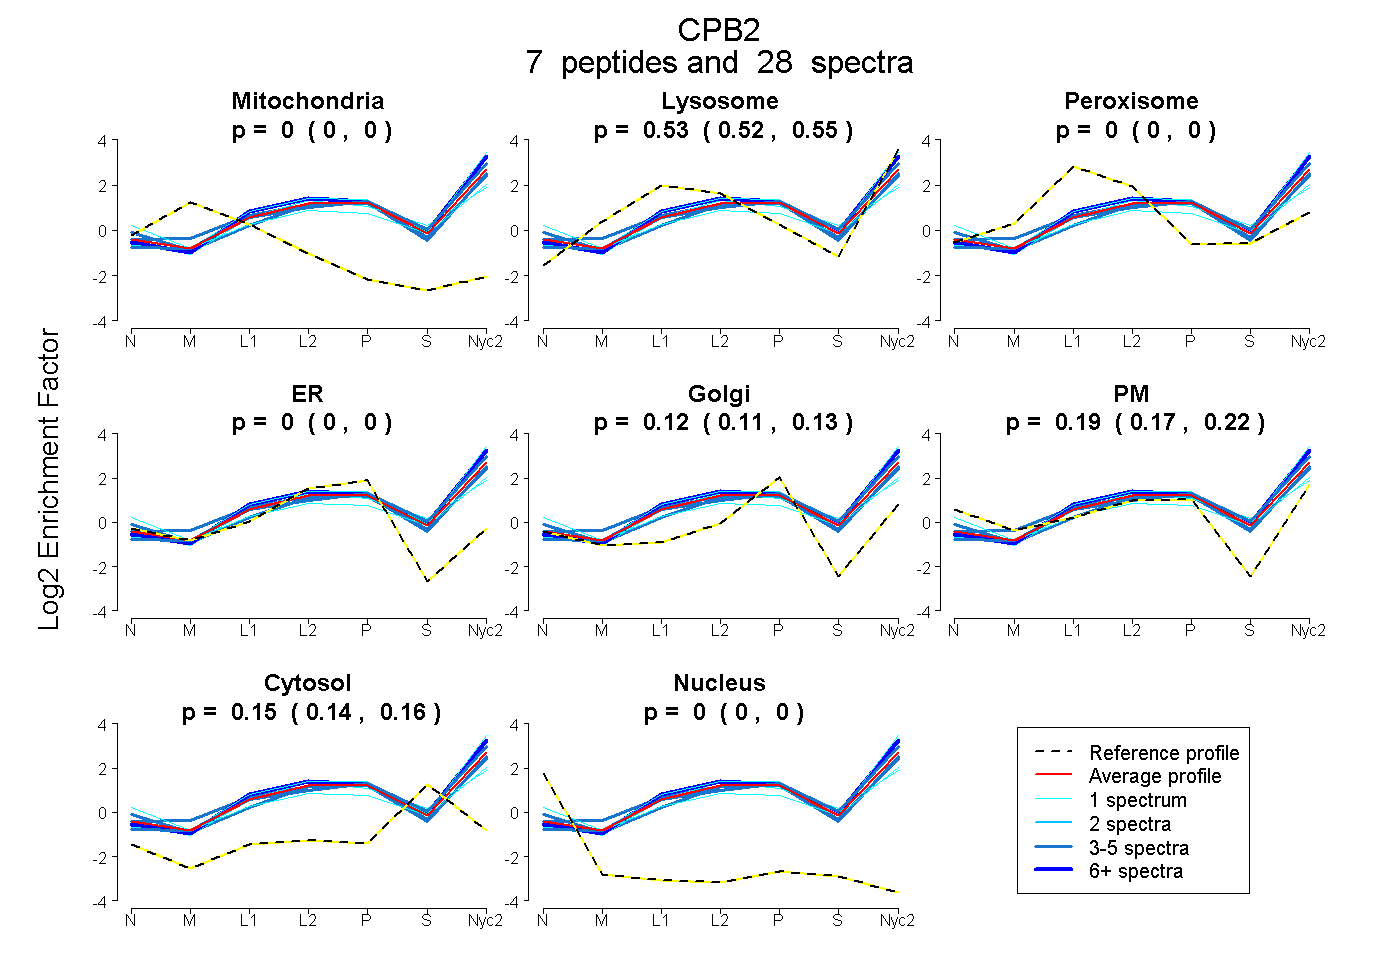
0.000 | 0.000
0.520 | 0.547
0.000 | 0.000
0.000 | 0.000
0.105 | 0.135
0.169 | 0.215
0.144 | 0.155
0.000 | 0.000
2peptides
spectra
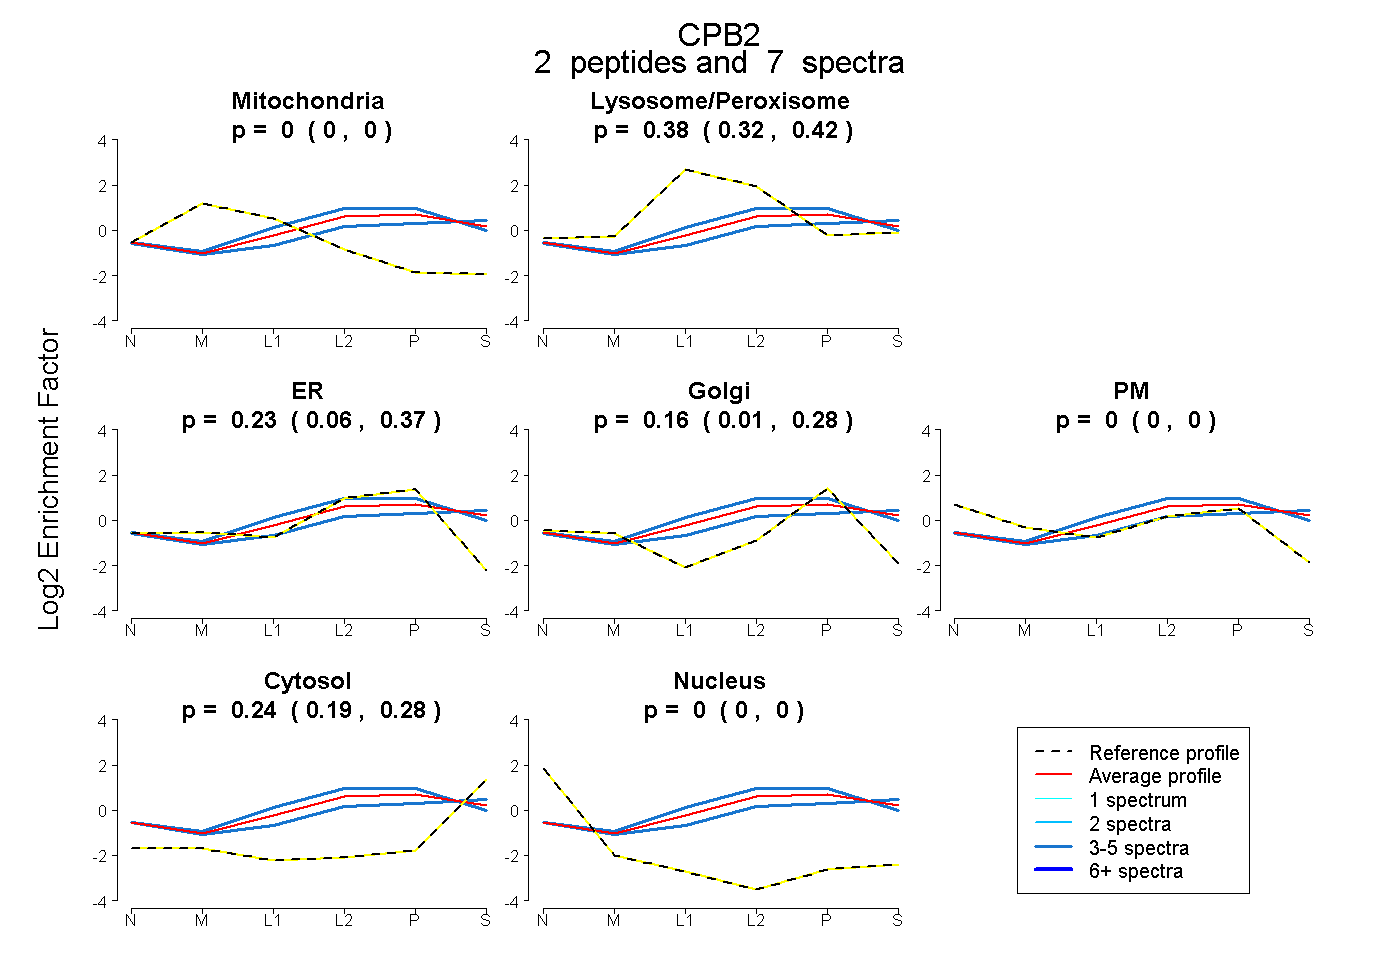
0.000 | 0.000
0.319 | 0.423
0.056 | 0.369
0.008 | 0.281
0.000 | 0.000
0.195 | 0.276
0.000 | 0.000
12peptides
spectra
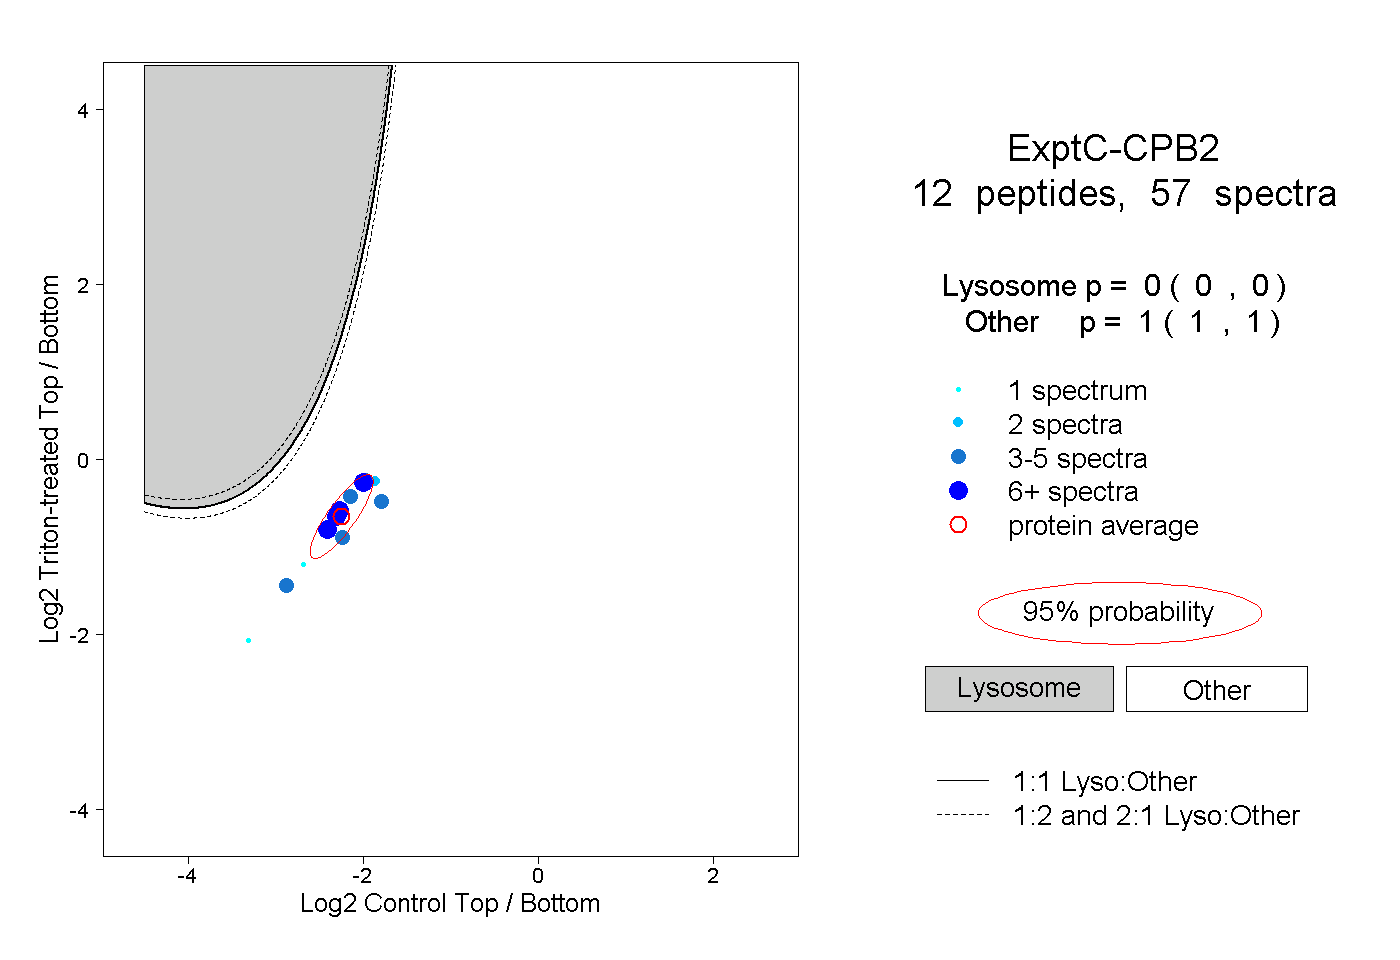
0.000 | 0.000
1.000 | 1.000
5peptides
spectra
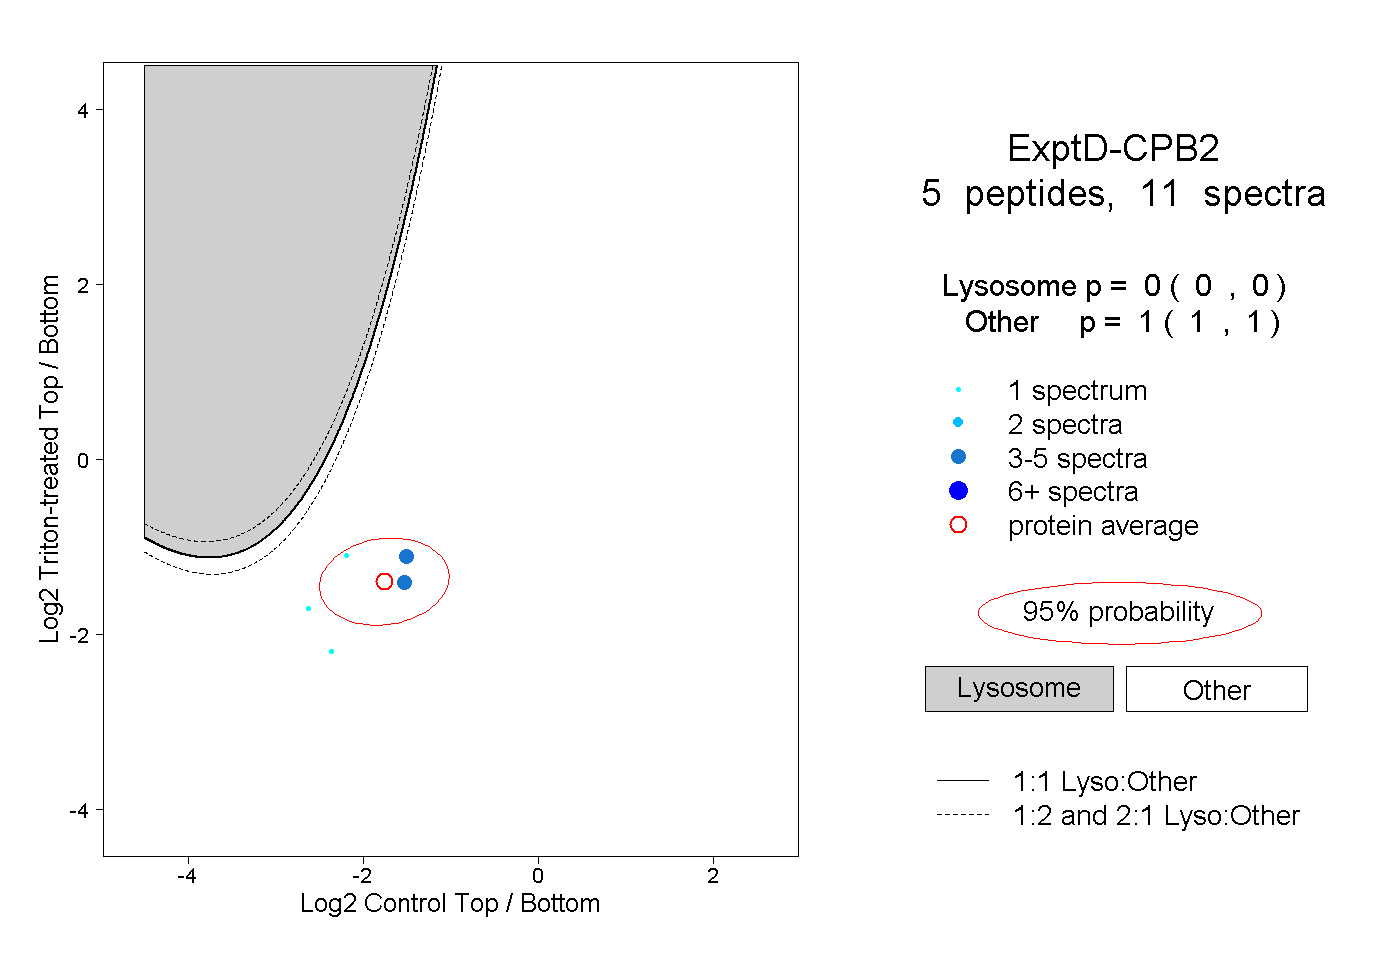
0.000 | 0.000
1.000 | 1.000