 7
7peptides
spectra
0.000 | 0.000
0.520 | 0.547
0.000 | 0.000
0.000 | 0.000
0.105 | 0.135
0.169 | 0.215
0.144 | 0.155
0.000 | 0.000
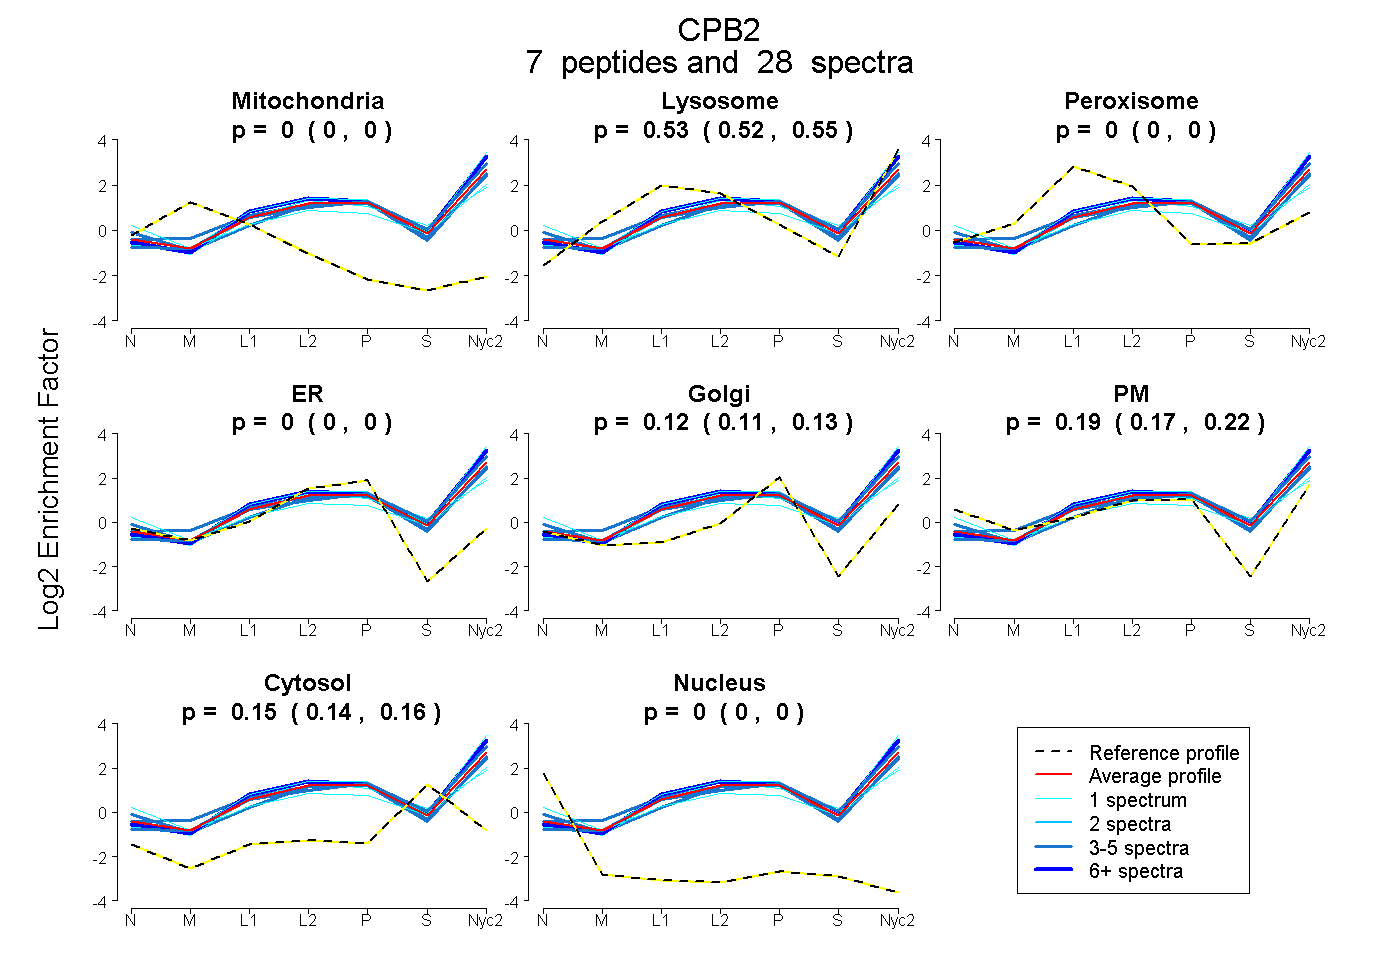
| Plot | Mito | Lyso | Perox | ER | Golgi | PM | Cytosol | Nucleus | |||||
| Expt A |
7 peptides |
28 spectra |
|
0.000 0.000 | 0.000 |
0.534 0.520 | 0.547 |
0.000 0.000 | 0.000 |
0.000 0.000 | 0.000 |
0.121 0.105 | 0.135 |
0.195 0.169 | 0.215 |
0.150 0.144 | 0.155 |
0.000 0.000 | 0.000 |
| 1 spectrum, FIKPTCAEALAAVSK | 0.000 | 0.466 | 0.000 | 0.147 | 0.000 | 0.133 | 0.253 | 0.000 | ||
| 5 spectra, ENTYTR | 0.000 | 0.369 | 0.000 | 0.000 | 0.063 | 0.399 | 0.169 | 0.000 | ||
| 4 spectra, YGFLLPER | 0.000 | 0.631 | 0.000 | 0.000 | 0.216 | 0.000 | 0.153 | 0.000 | ||
| 1 spectrum, YPLYVLK | 0.000 | 0.297 | 0.000 | 0.000 | 0.000 | 0.464 | 0.239 | 0.000 | ||
| 1 spectrum, NINHIK | 0.000 | 0.721 | 0.000 | 0.000 | 0.203 | 0.000 | 0.076 | 0.000 | ||
| 5 spectra, CVGTDLNR | 0.000 | 0.526 | 0.000 | 0.000 | 0.139 | 0.227 | 0.108 | 0.000 | ||
| 11 spectra, IAWHVIR | 0.000 | 0.662 | 0.000 | 0.000 | 0.119 | 0.101 | 0.119 | 0.000 |
| Plot | Mito | Lyso or Perox | ER | Golgi | PM | Cytosol | Nucleus | ||||||
| Expt B |
2 peptides |
7 spectra |
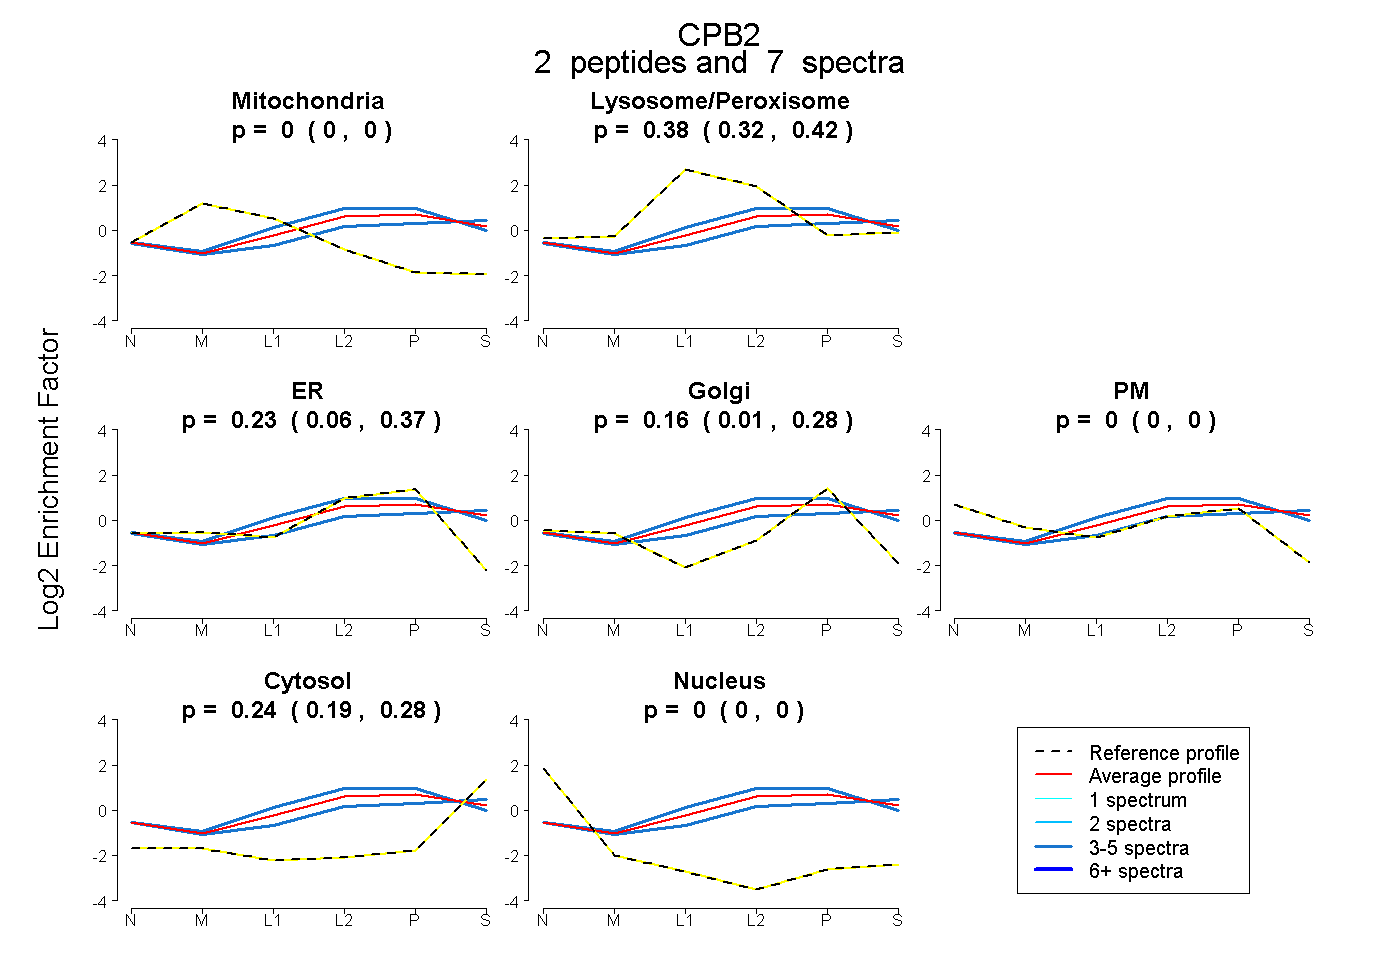 |
0.000 0.000 | 0.000 |
0.375 0.319 | 0.423 |
0.229 0.056 | 0.369 |
0.157 0.008 | 0.281 |
0.000 0.000 | 0.000 |
0.239 0.195 | 0.276 |
0.000 0.000 | 0.000 |
|||
| Plot | Lyso | Other | |||||||||||
| Expt C |
12 peptides |
57 spectra |
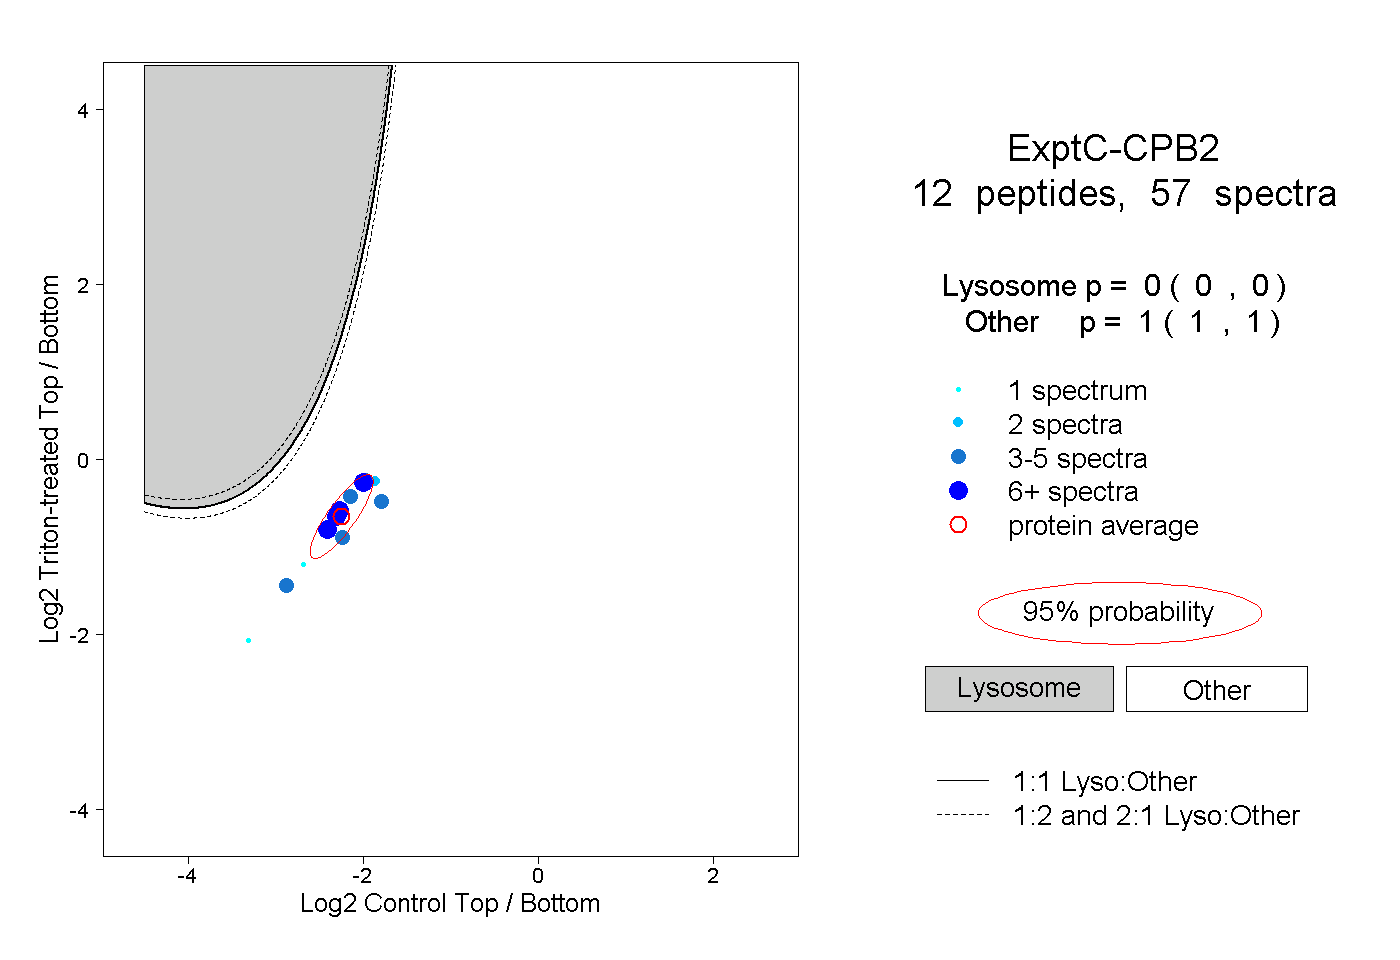 |
0.000 0.000 | 0.000 |
1.000 1.000 | 1.000 |
||||||||
| Plot | Lyso | Other | |||||||||||
| Expt D |
5 peptides |
11 spectra |
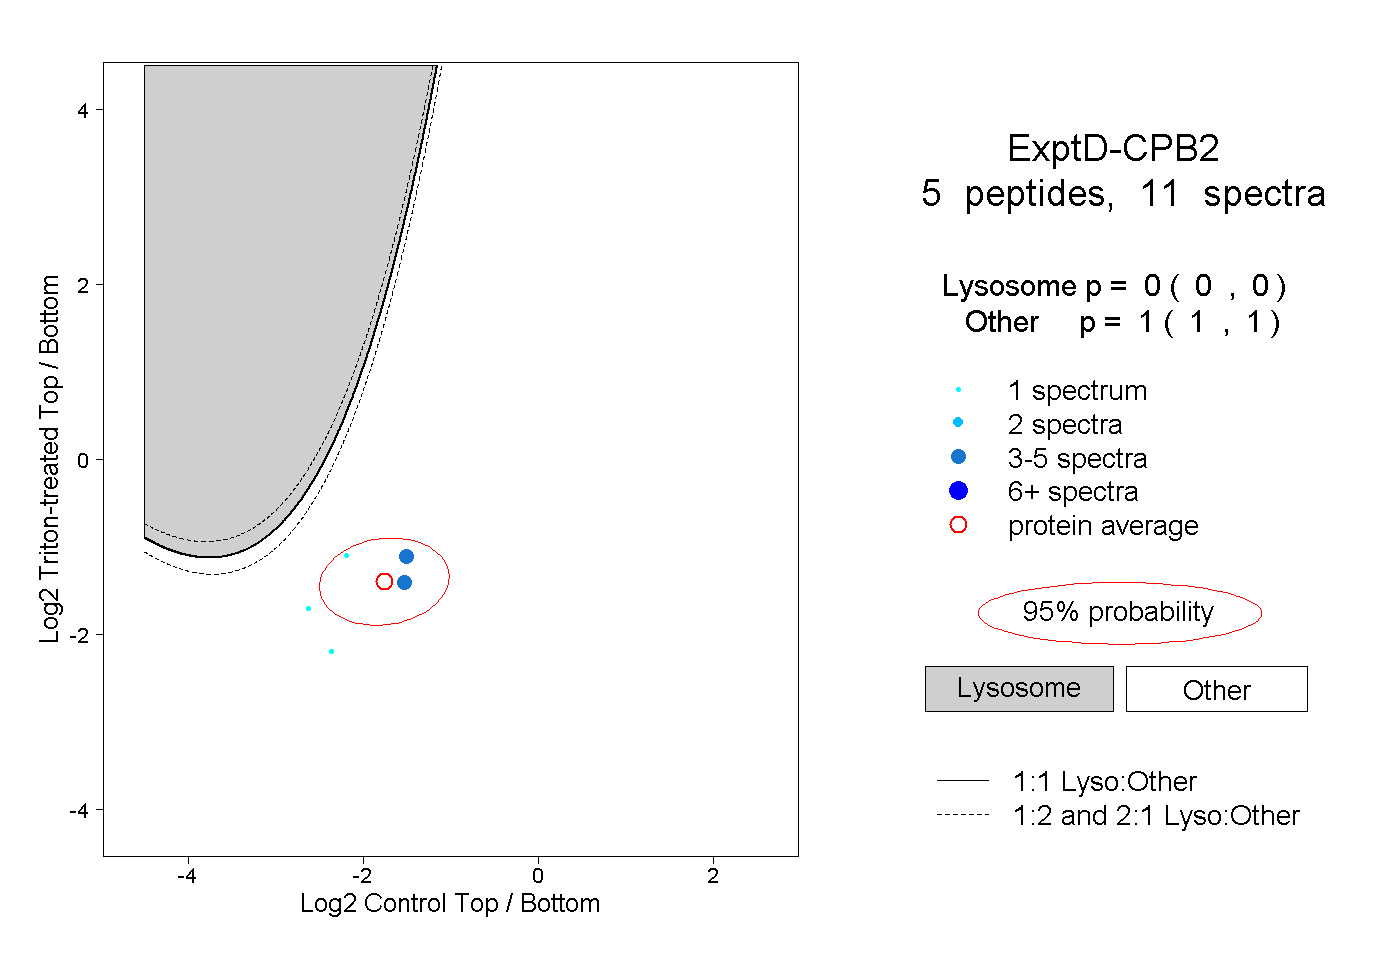 |
0.000 0.000 | 0.000 |
1.000 1.000 | 1.000 |