 5
5peptides
spectra
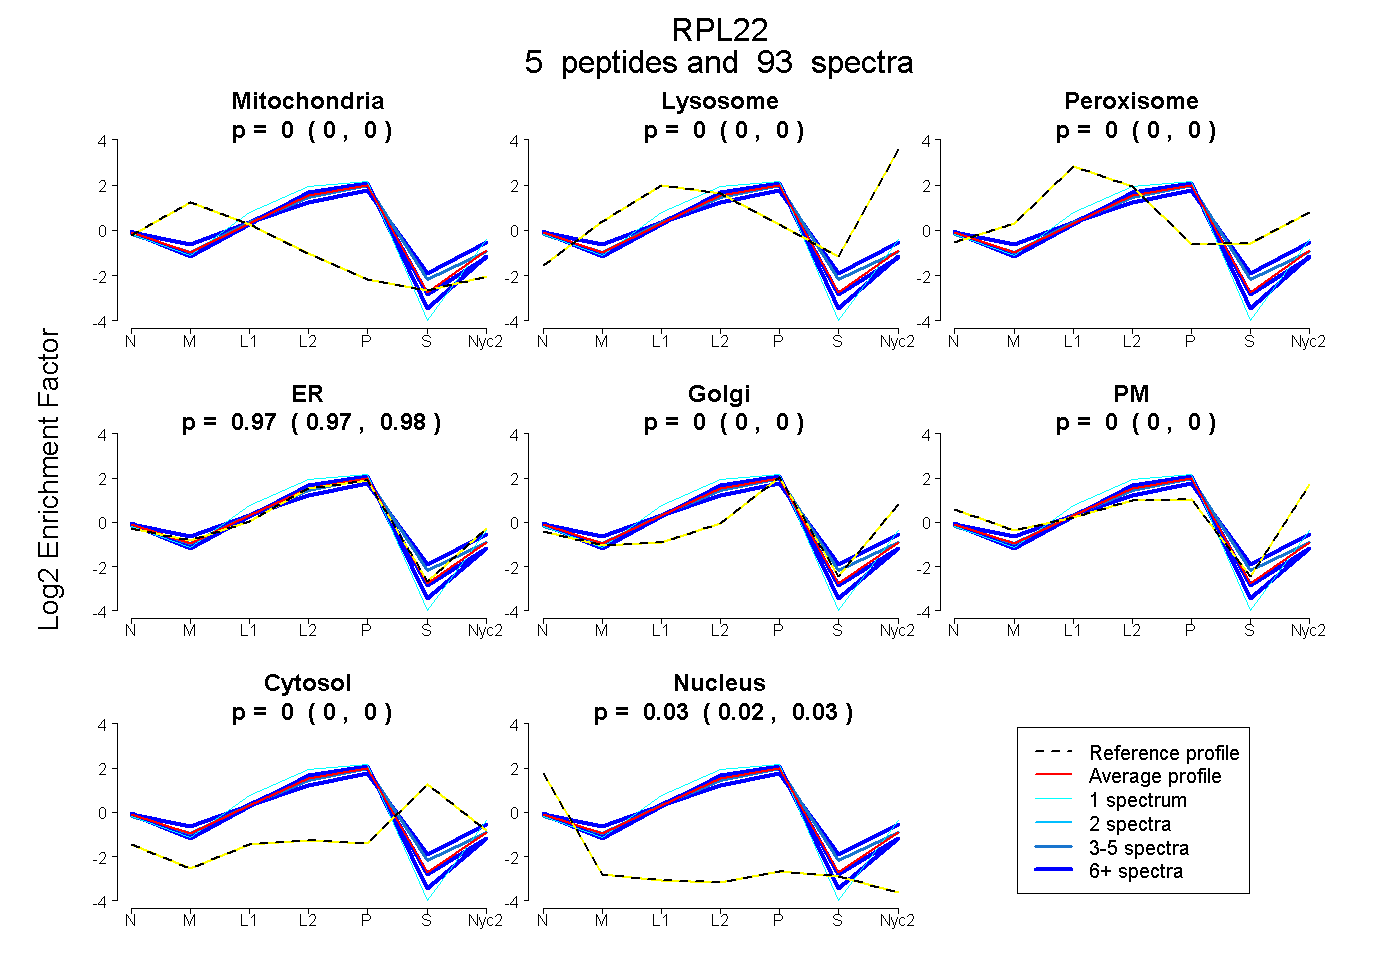
0.000 | 0.000
0.000 | 0.000
0.000 | 0.000
0.972 | 0.977
0.000 | 0.000
0.000 | 0.000
0.000 | 0.000
0.023 | 0.027
3peptides
spectra
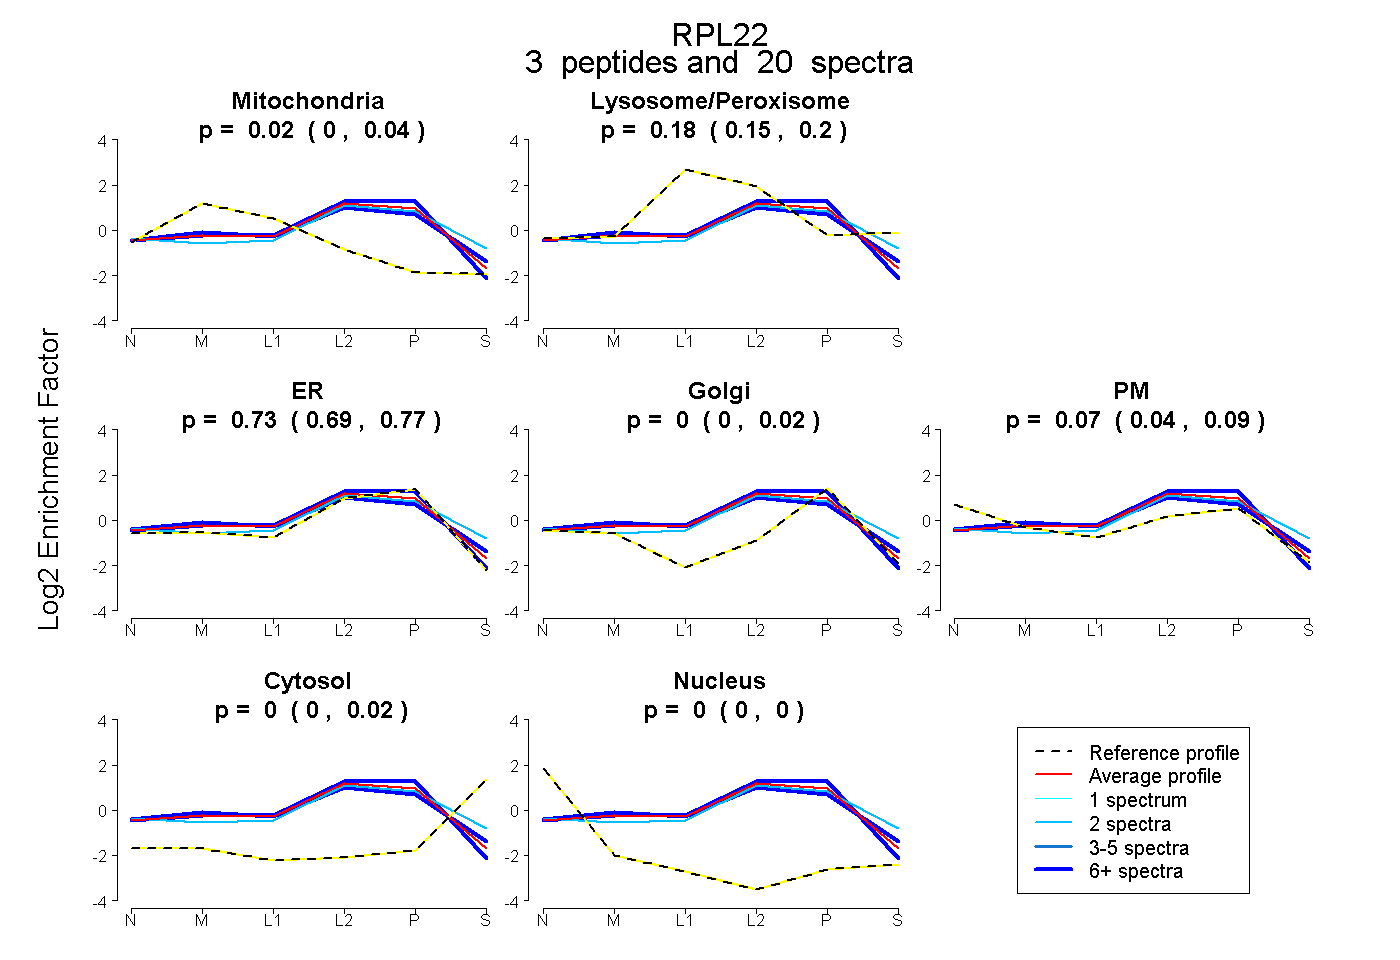
0.000 | 0.039
0.153 | 0.198
0.687 | 0.766
0.000 | 0.020
0.040 | 0.088
0.000 | 0.018
0.000 | 0.000
4peptides
spectra
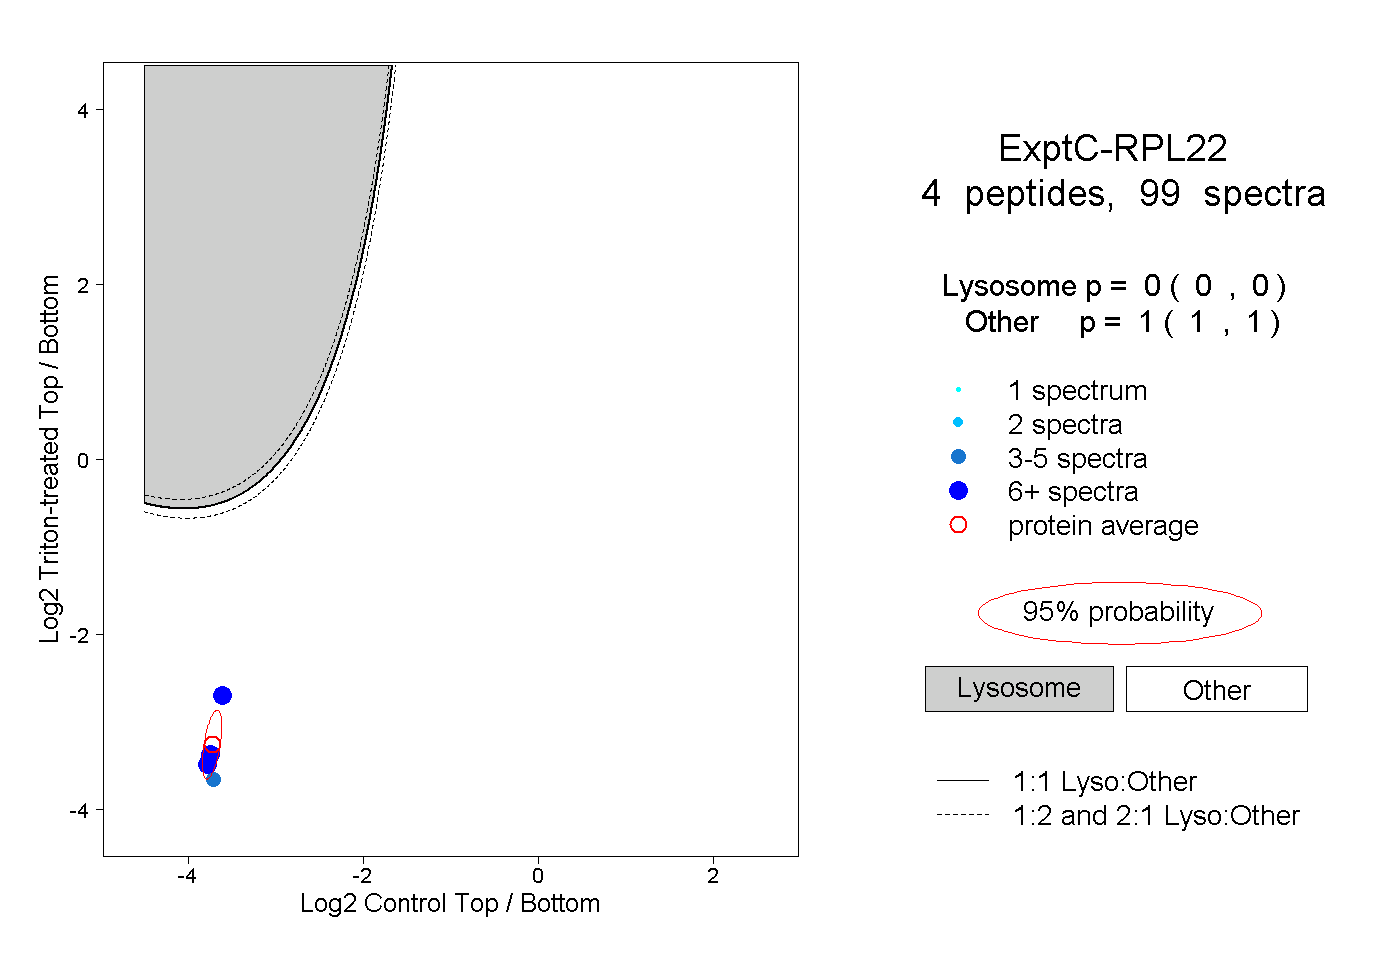
0.000 | 0.000
1.000 | 1.000
4peptides
spectra
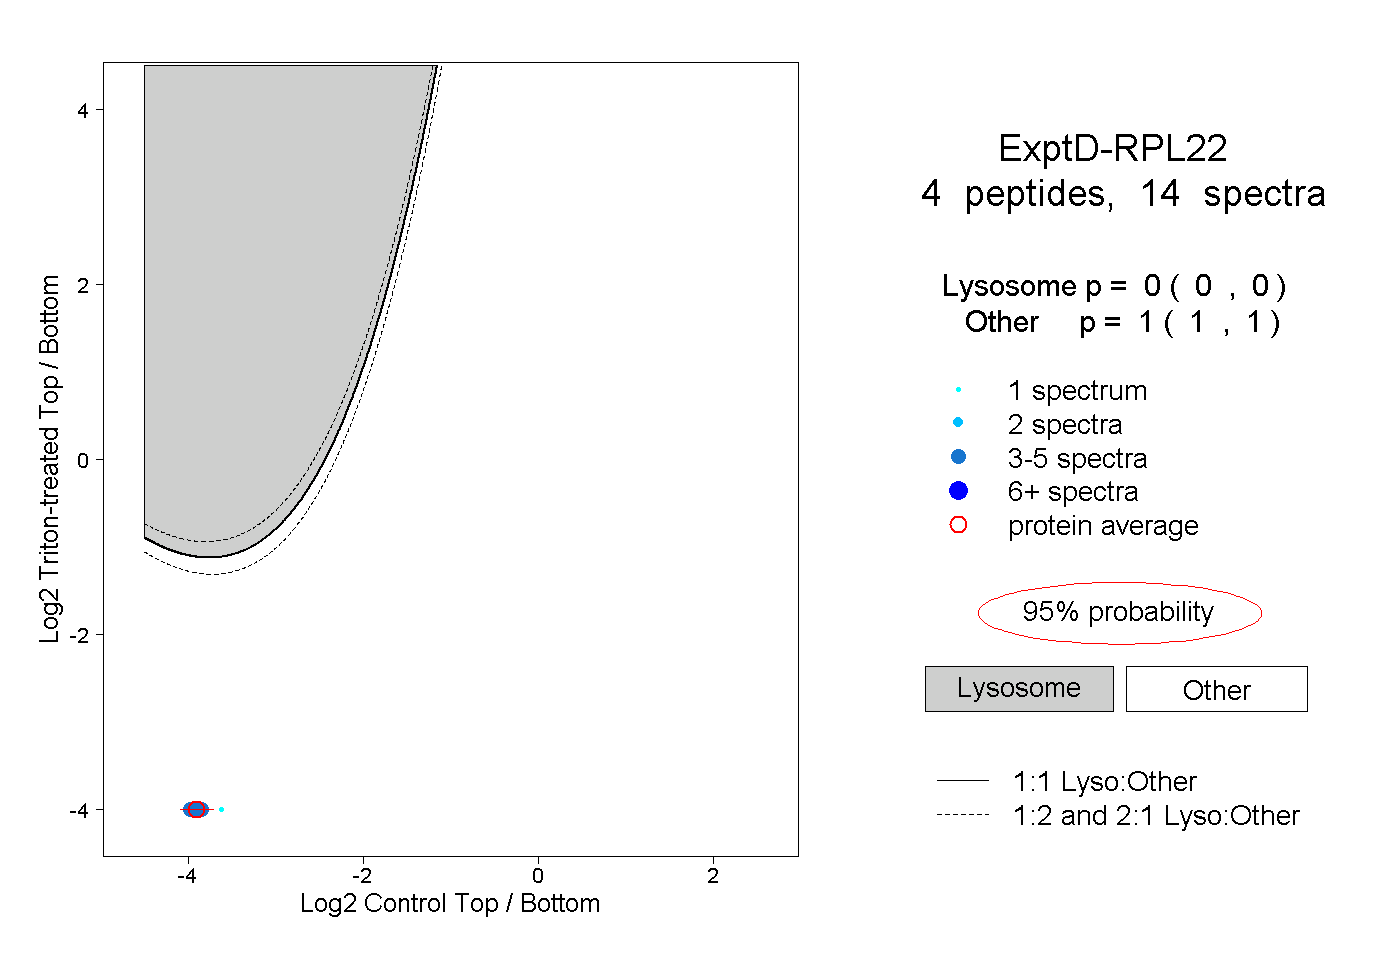
0.000 | 0.000
1.000 | 1.000