 5
5peptides
spectra
0.000 | 0.000
0.000 | 0.000
0.000 | 0.000
0.972 | 0.977
0.000 | 0.000
0.000 | 0.000
0.000 | 0.000
0.023 | 0.027
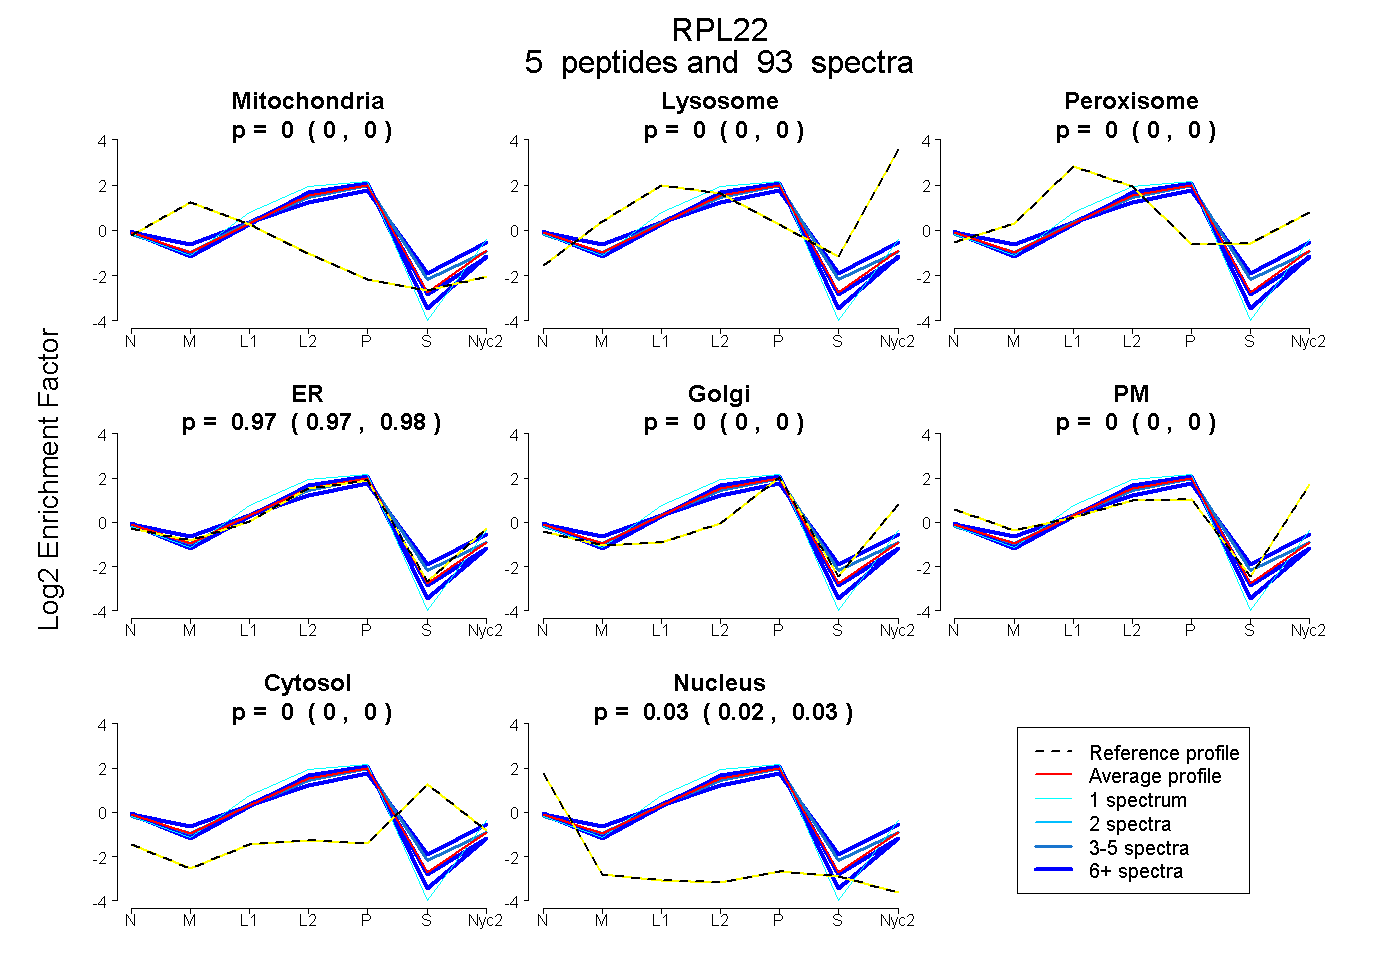
| Plot | Mito | Lyso | Perox | ER | Golgi | PM | Cytosol | Nucleus | |||||
| Expt A |
5 peptides |
93 spectra |
|
0.000 0.000 | 0.000 |
0.000 0.000 | 0.000 |
0.000 0.000 | 0.000 |
0.975 0.972 | 0.977 |
0.000 0.000 | 0.000 |
0.000 0.000 | 0.000 |
0.000 0.000 | 0.000 |
0.025 0.023 | 0.027 |
| 61 spectra, ESYELR | 0.011 | 0.000 | 0.085 | 0.840 | 0.000 | 0.000 | 0.061 | 0.004 | ||
| 12 spectra, AGNLGGGVVTIER | 0.000 | 0.000 | 0.000 | 0.962 | 0.000 | 0.000 | 0.000 | 0.038 | ||
| 14 spectra, VVANSK | 0.000 | 0.000 | 0.000 | 0.968 | 0.000 | 0.000 | 0.000 | 0.032 | ||
| 5 spectra, ITVTSEVPFSK | 0.000 | 0.000 | 0.015 | 0.936 | 0.000 | 0.000 | 0.044 | 0.005 | ||
| 1 spectrum, VVASNK | 0.000 | 0.000 | 0.000 | 1.000 | 0.000 | 0.000 | 0.000 | 0.000 |
| Plot | Mito | Lyso or Perox | ER | Golgi | PM | Cytosol | Nucleus | ||||||
| Expt B |
3 peptides |
20 spectra |
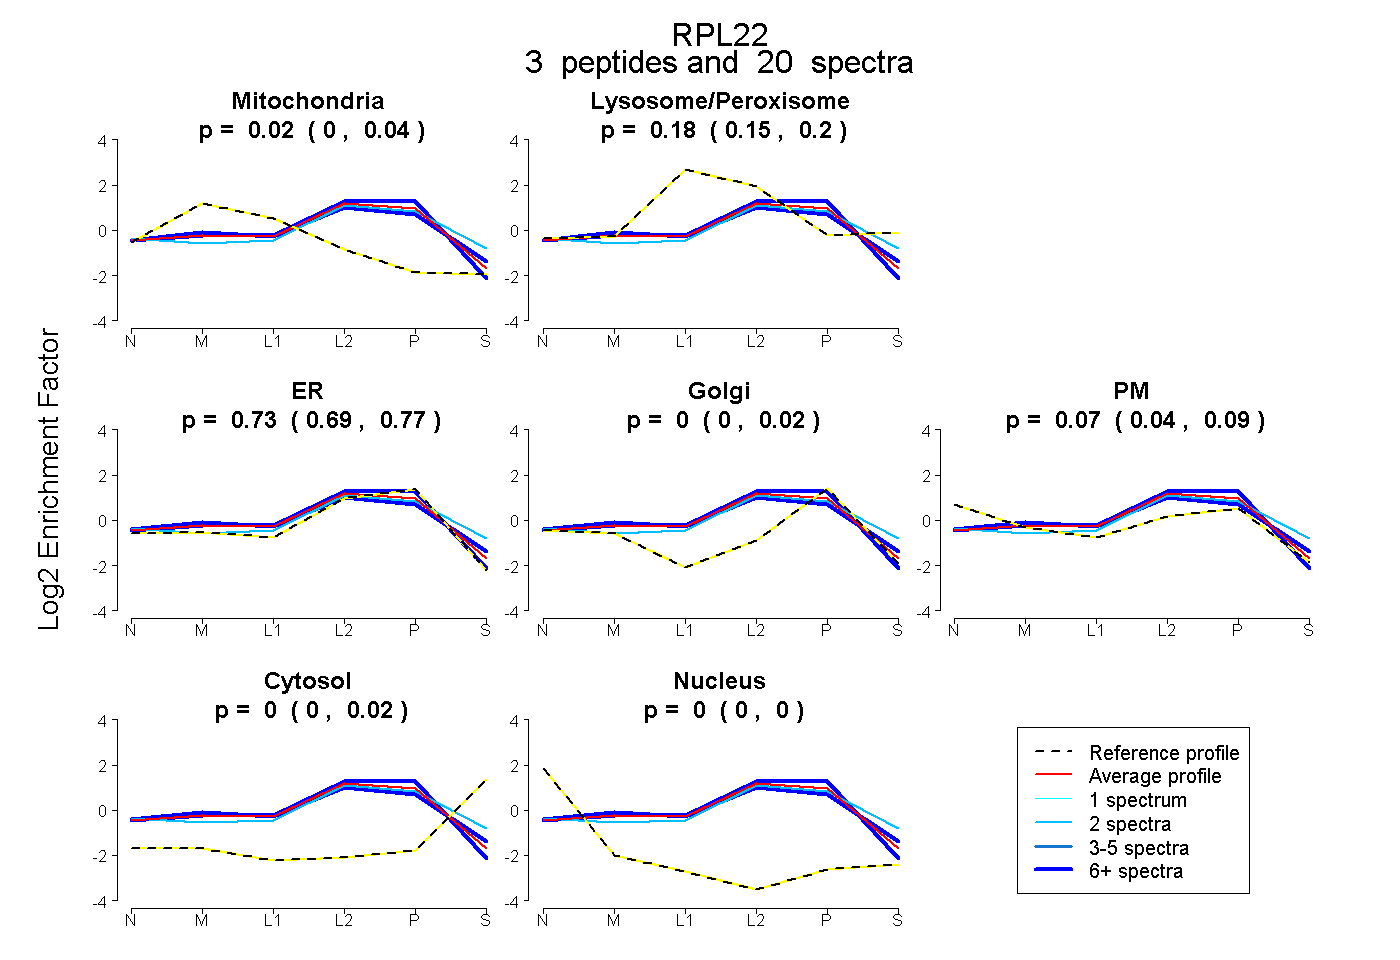 |
0.018 0.000 | 0.039 |
0.175 0.153 | 0.198 |
0.731 0.687 | 0.766 |
0.000 0.000 | 0.020 |
0.074 0.040 | 0.088 |
0.002 0.000 | 0.018 |
0.000 0.000 | 0.000 |
|||
| Plot | Lyso | Other | |||||||||||
| Expt C |
4 peptides |
99 spectra |
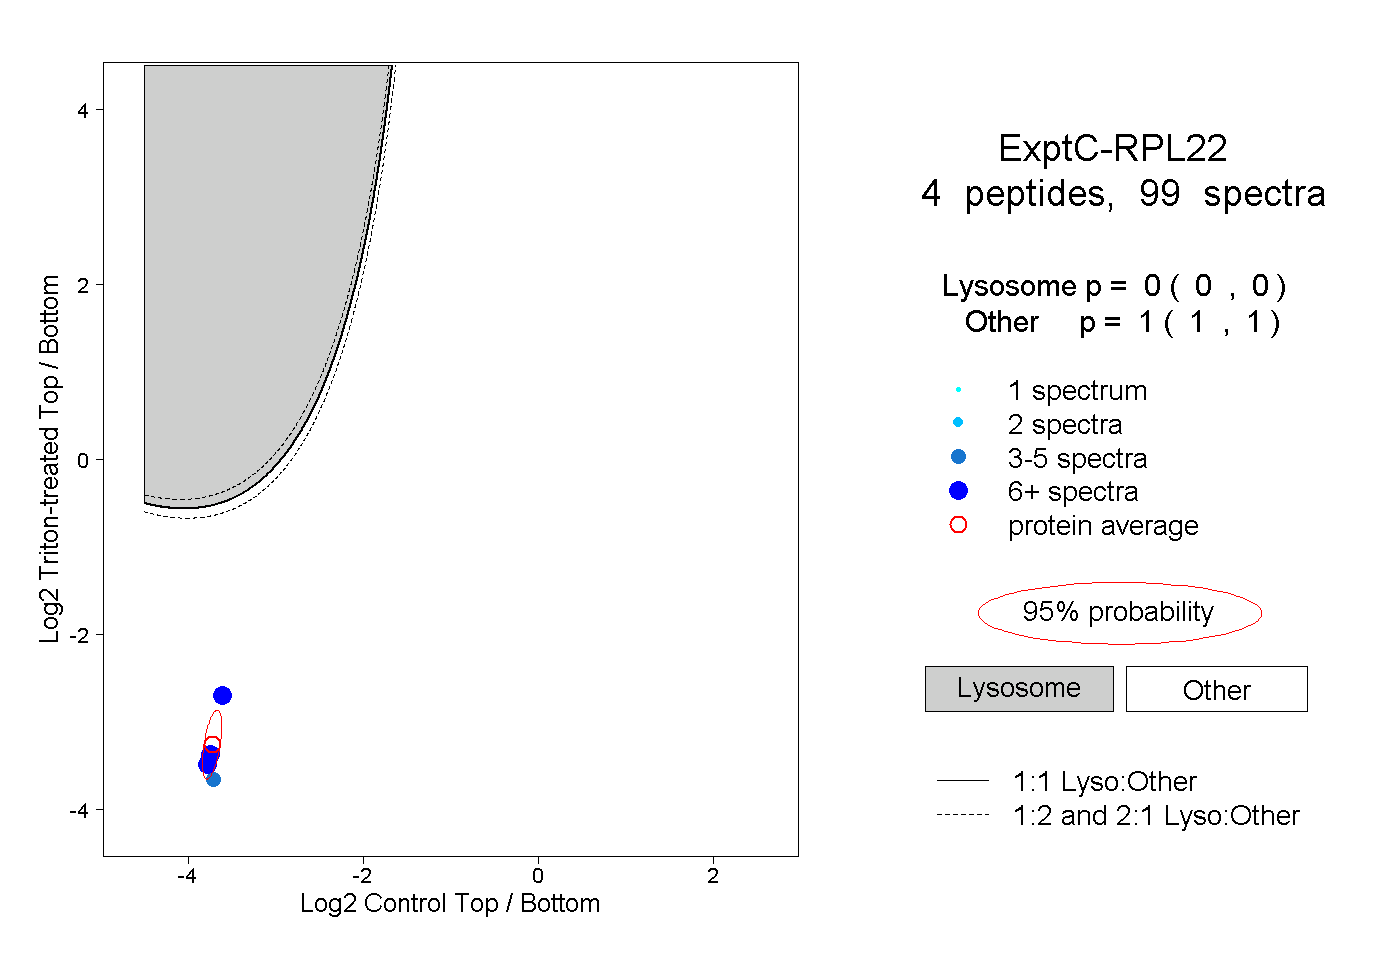 |
0.000 0.000 | 0.000 |
1.000 1.000 | 1.000 |
||||||||
| Plot | Lyso | Other | |||||||||||
| Expt D |
4 peptides |
14 spectra |
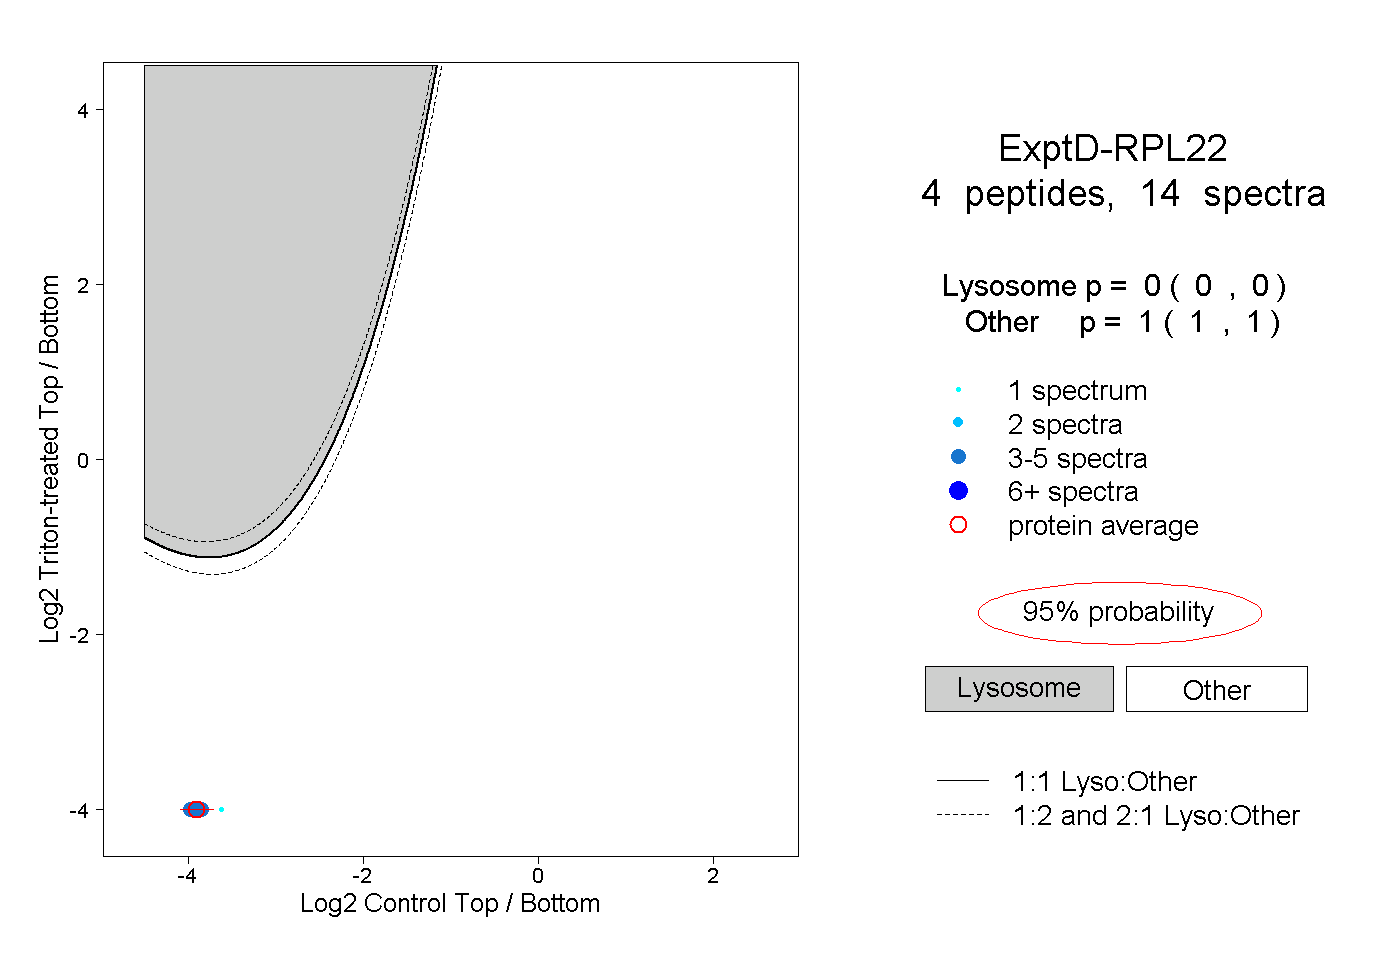 |
0.000 0.000 | 0.000 |
1.000 1.000 | 1.000 |