 20
20peptides
spectra
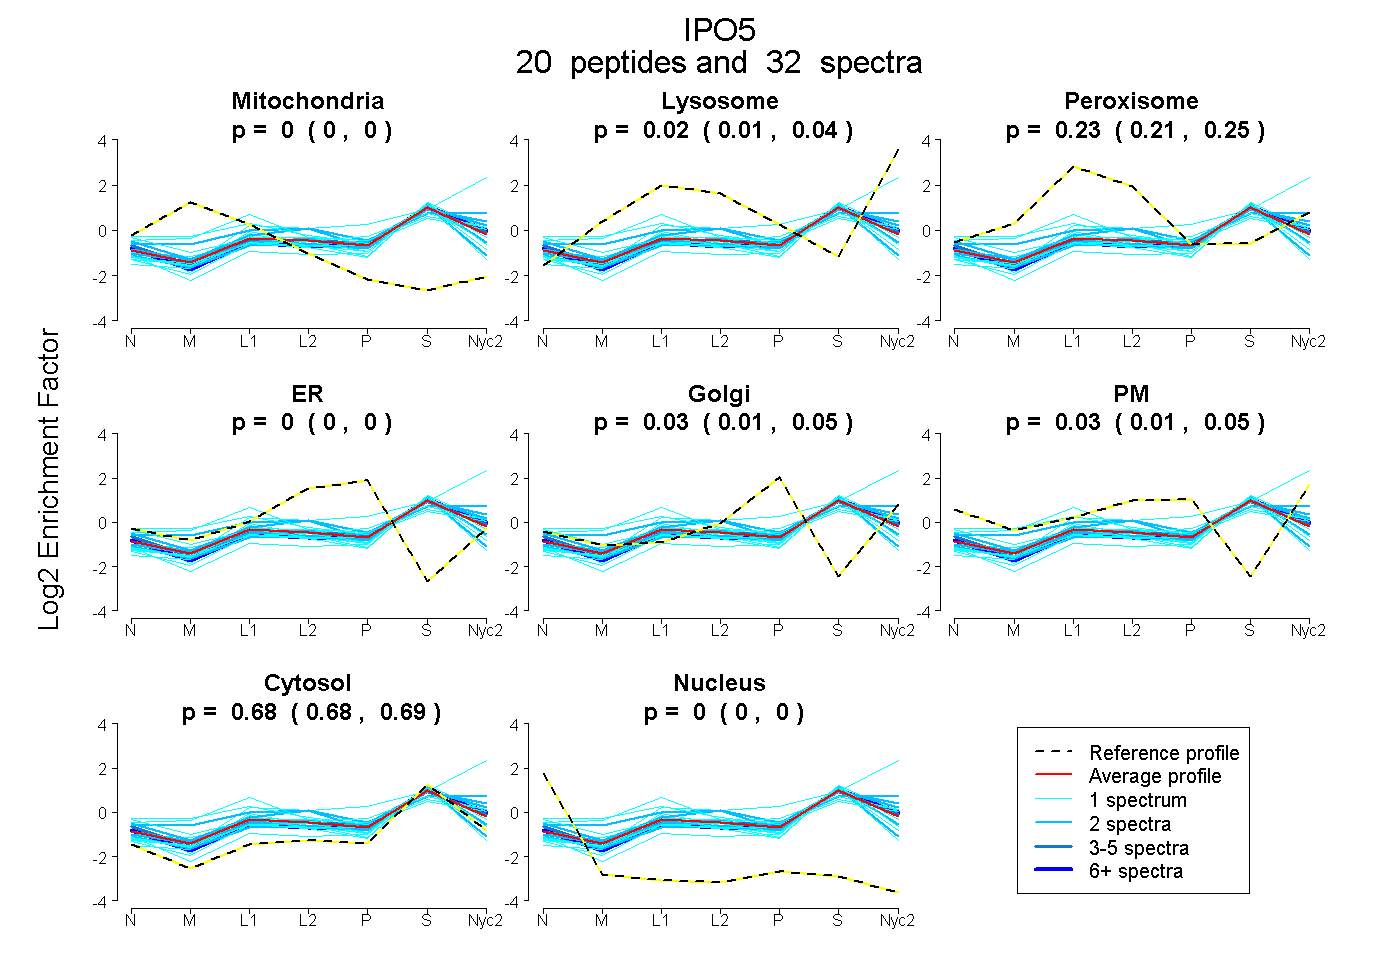
0.000 | 0.000
0.006 | 0.038
0.213 | 0.251
0.000 | 0.000
0.006 | 0.045
0.009 | 0.054
0.676 | 0.687
0.000 | 0.000
5peptides
spectra
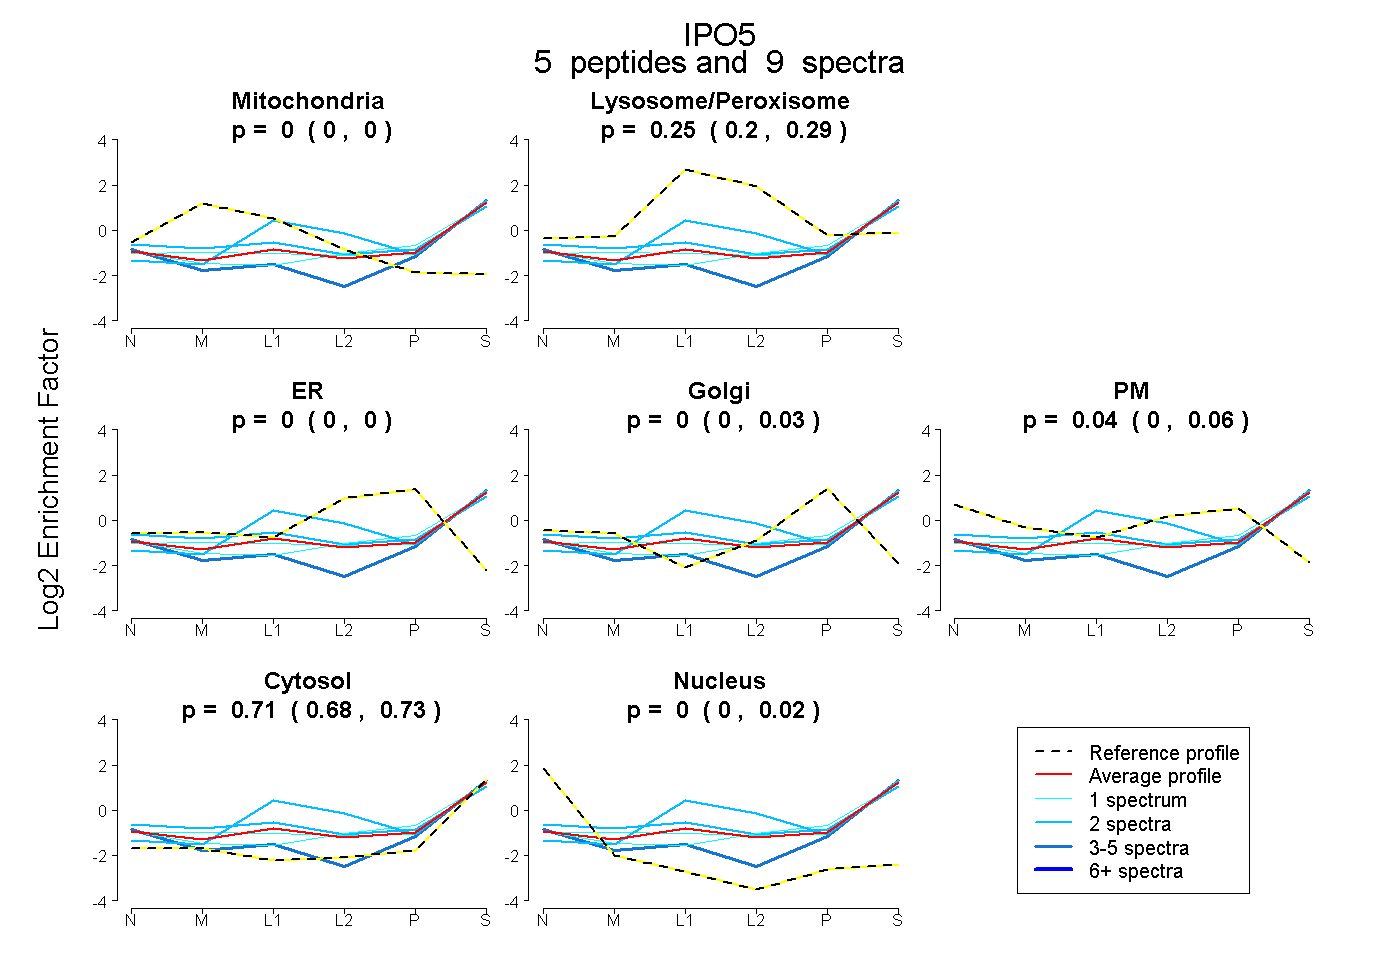
0.000 | 0.000
0.202 | 0.295
0.000 | 0.000
0.000 | 0.029
0.000 | 0.062
0.682 | 0.729
0.000 | 0.022
17peptides
spectra
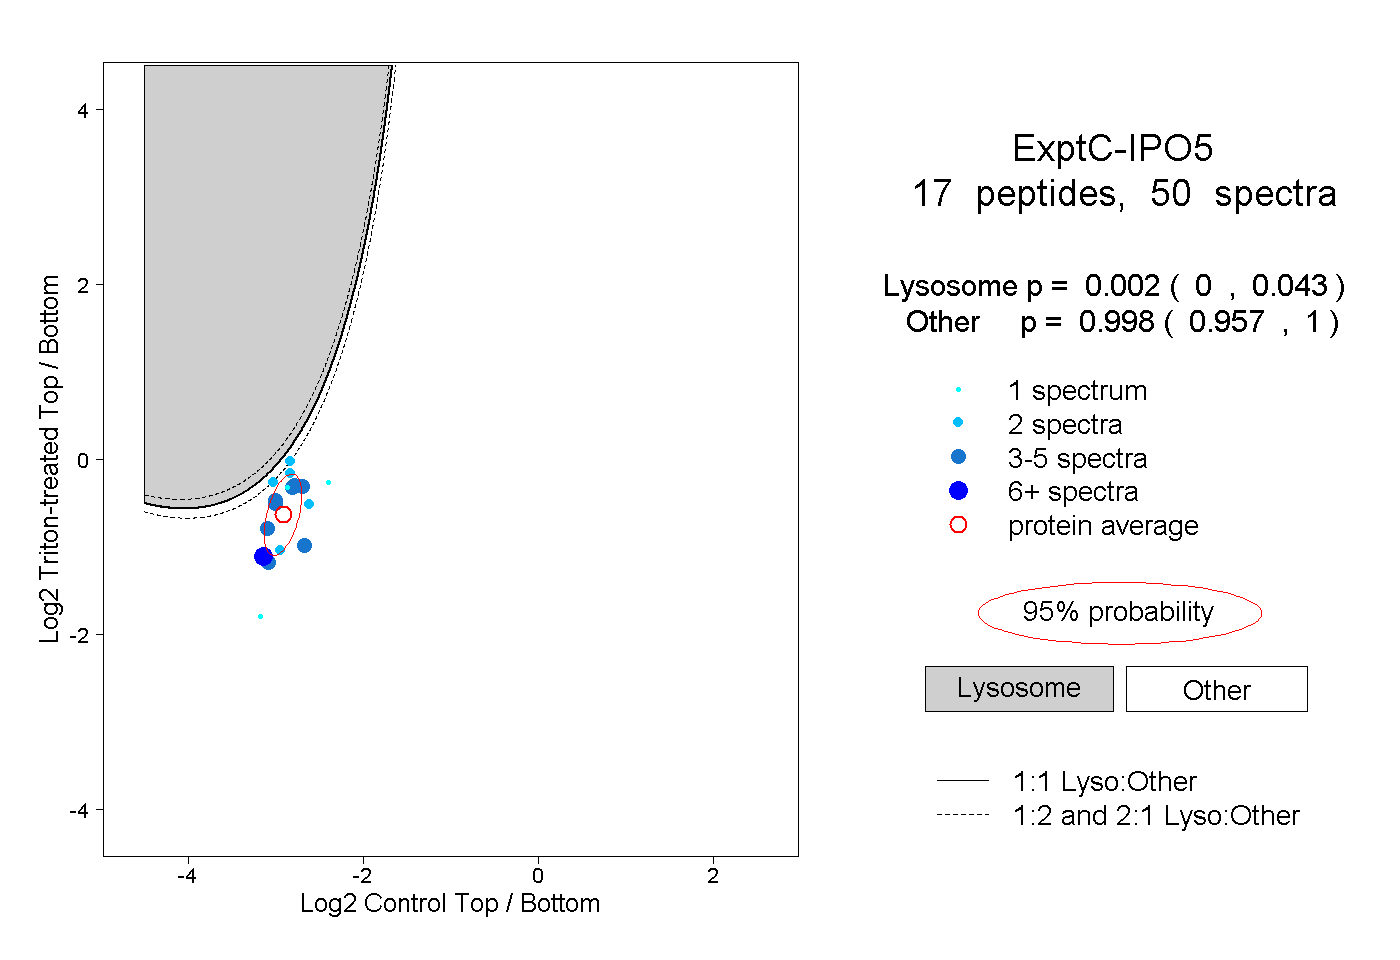
0.000 | 0.043
0.957 | 1.000
1peptide
spectra
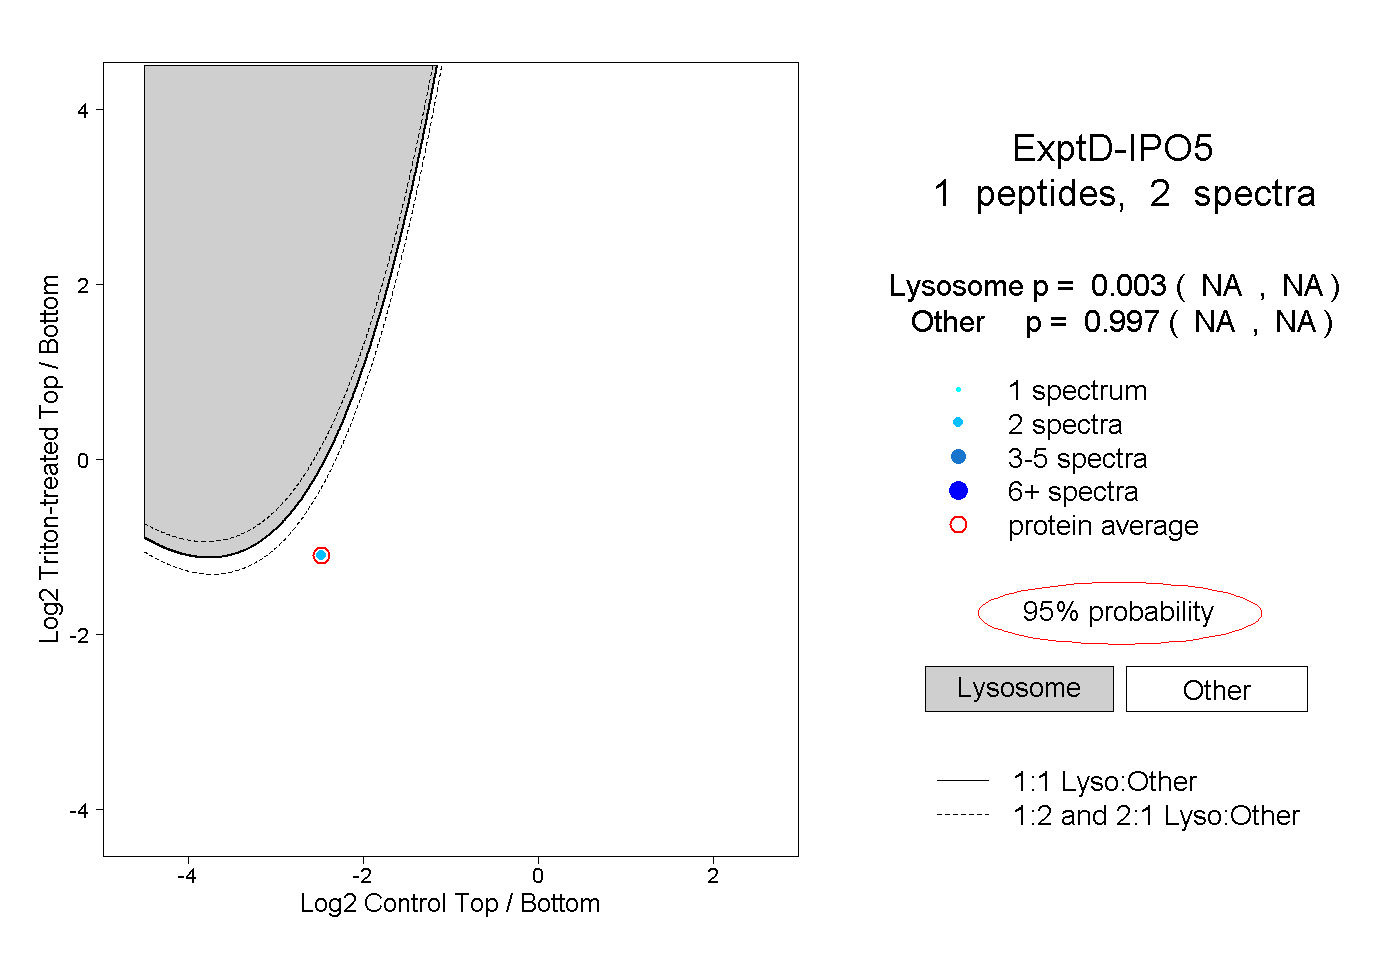
NA | NA
NA | NA