 20
20peptides
spectra
0.000 | 0.000
0.006 | 0.038
0.213 | 0.251
0.000 | 0.000
0.006 | 0.045
0.009 | 0.054
0.676 | 0.687
0.000 | 0.000
| Plot | Mito | Lyso | Perox | ER | Golgi | PM | Cytosol | Nucleus | |||||
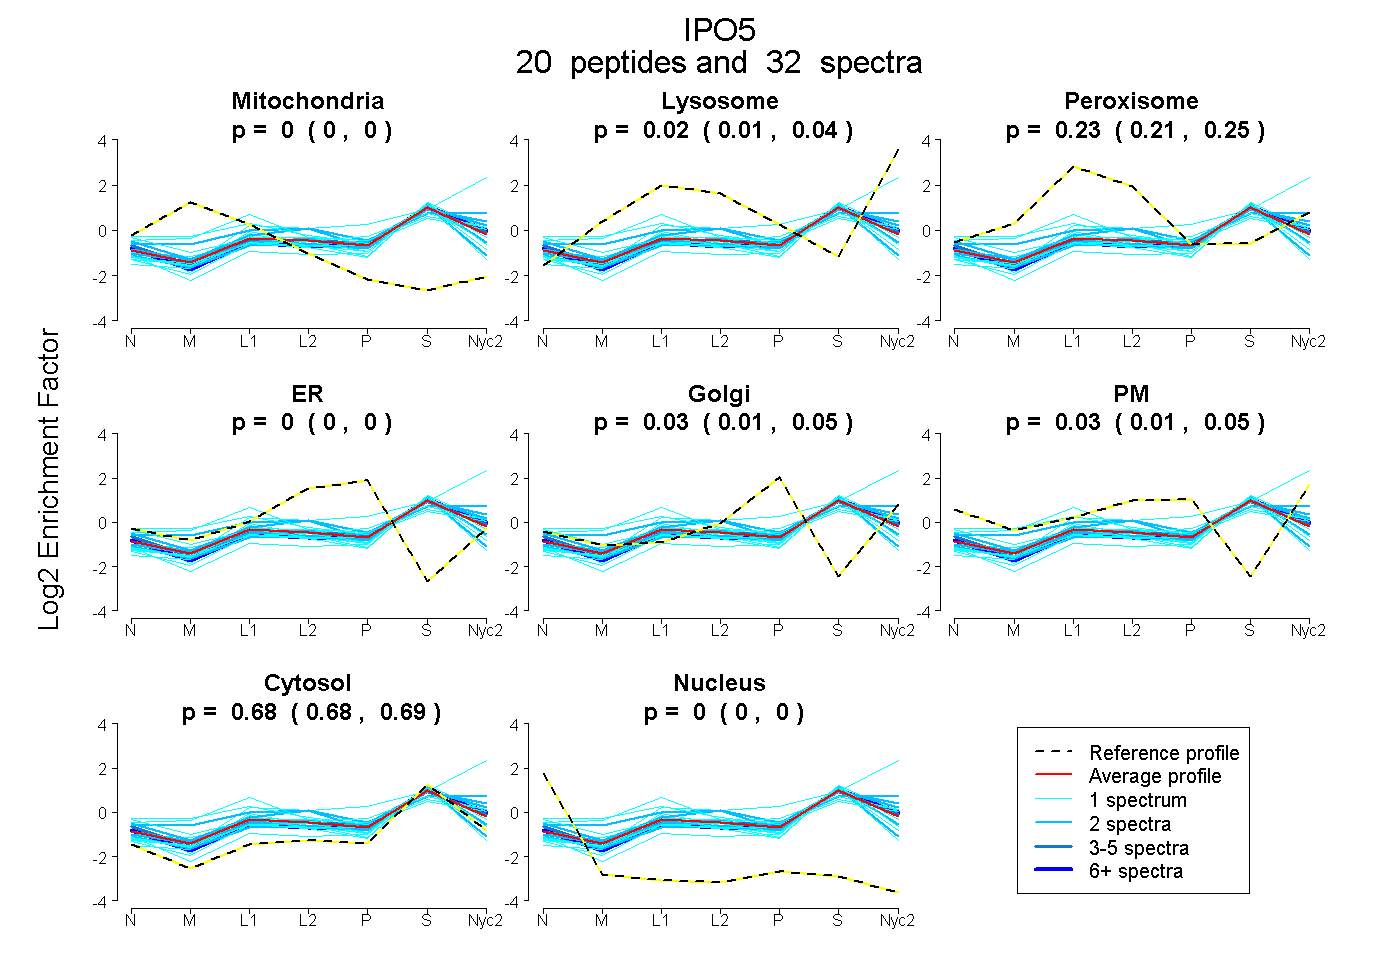
| Expt A |
20 peptides |
32 spectra |
|
0.000 0.000 | 0.000 |
0.023 0.006 | 0.038 |
0.234 0.213 | 0.251 |
0.000 0.000 | 0.000 |
0.027 0.006 | 0.045 |
0.035 0.009 | 0.054 |
0.682 0.676 | 0.687 |
0.000 0.000 | 0.000 |
| 1 spectrum, VAAAESMPLLLECAR | 0.042 | 0.000 | 0.134 | 0.057 | 0.000 | 0.000 | 0.768 | 0.000 | ||
| 2 spectra, LANVVR | 0.000 | 0.204 | 0.188 | 0.000 | 0.000 | 0.100 | 0.509 | 0.000 | ||
| 1 spectrum, ATAAFILANEHNVALFK | 0.000 | 0.000 | 0.214 | 0.000 | 0.000 | 0.093 | 0.693 | 0.000 | ||
| 6 spectra, FYFHDGVR | 0.000 | 0.068 | 0.111 | 0.000 | 0.000 | 0.081 | 0.740 | 0.000 | ||
| 1 spectrum, SLLIPYLDNLVK | 0.000 | 0.000 | 0.088 | 0.000 | 0.031 | 0.000 | 0.881 | 0.000 | ||
| 1 spectrum, EFQQYLPVVMGPLMK | 0.038 | 0.000 | 0.243 | 0.000 | 0.000 | 0.000 | 0.719 | 0.000 | ||
| 1 spectrum, VIQSADSK | 0.047 | 0.015 | 0.429 | 0.000 | 0.036 | 0.033 | 0.439 | 0.000 | ||
| 1 spectrum, STACQMLVCYAK | 0.059 | 0.000 | 0.167 | 0.016 | 0.000 | 0.000 | 0.757 | 0.000 | ||
| 2 spectra, QAEETYENIPGR | 0.000 | 0.132 | 0.112 | 0.000 | 0.001 | 0.074 | 0.680 | 0.000 | ||
| 1 spectrum, HLHSIMVLK | 0.000 | 0.101 | 0.177 | 0.000 | 0.000 | 0.000 | 0.722 | 0.000 | ||
| 1 spectrum, YAACNAVGQMATDFAPGFQK | 0.084 | 0.000 | 0.343 | 0.000 | 0.000 | 0.125 | 0.447 | 0.000 | ||
| 1 spectrum, HEDPCAK | 0.037 | 0.000 | 0.198 | 0.000 | 0.067 | 0.000 | 0.698 | 0.000 | ||
| 3 spectra, HIVENAVQK | 0.000 | 0.000 | 0.181 | 0.000 | 0.000 | 0.134 | 0.685 | 0.000 | ||
| 1 spectrum, NLIDEDGNNQWPEGLK | 0.000 | 0.000 | 0.176 | 0.000 | 0.000 | 0.000 | 0.824 | 0.000 | ||
| 1 spectrum, TAGLEEK | 0.000 | 0.000 | 0.170 | 0.000 | 0.000 | 0.246 | 0.584 | 0.000 | ||
| 1 spectrum, SLVEIADTVPK | 0.000 | 0.027 | 0.234 | 0.000 | 0.000 | 0.000 | 0.739 | 0.000 | ||
| 2 spectra, LCGDTNLNNMQR | 0.042 | 0.000 | 0.192 | 0.043 | 0.000 | 0.000 | 0.723 | 0.000 | ||
| 2 spectra, LQELIQK | 0.000 | 0.000 | 0.190 | 0.000 | 0.041 | 0.000 | 0.769 | 0.000 | ||
| 1 spectrum, EGFVEYTEQVVK | 0.000 | 0.532 | 0.000 | 0.000 | 0.000 | 0.000 | 0.468 | 0.000 | ||
| 2 spectra, NTTAAEEAR | 0.000 | 0.080 | 0.234 | 0.000 | 0.000 | 0.089 | 0.596 | 0.000 |
| Plot | Mito | Lyso or Perox | ER | Golgi | PM | Cytosol | Nucleus | ||||||
| Expt B |
5 peptides |
9 spectra |
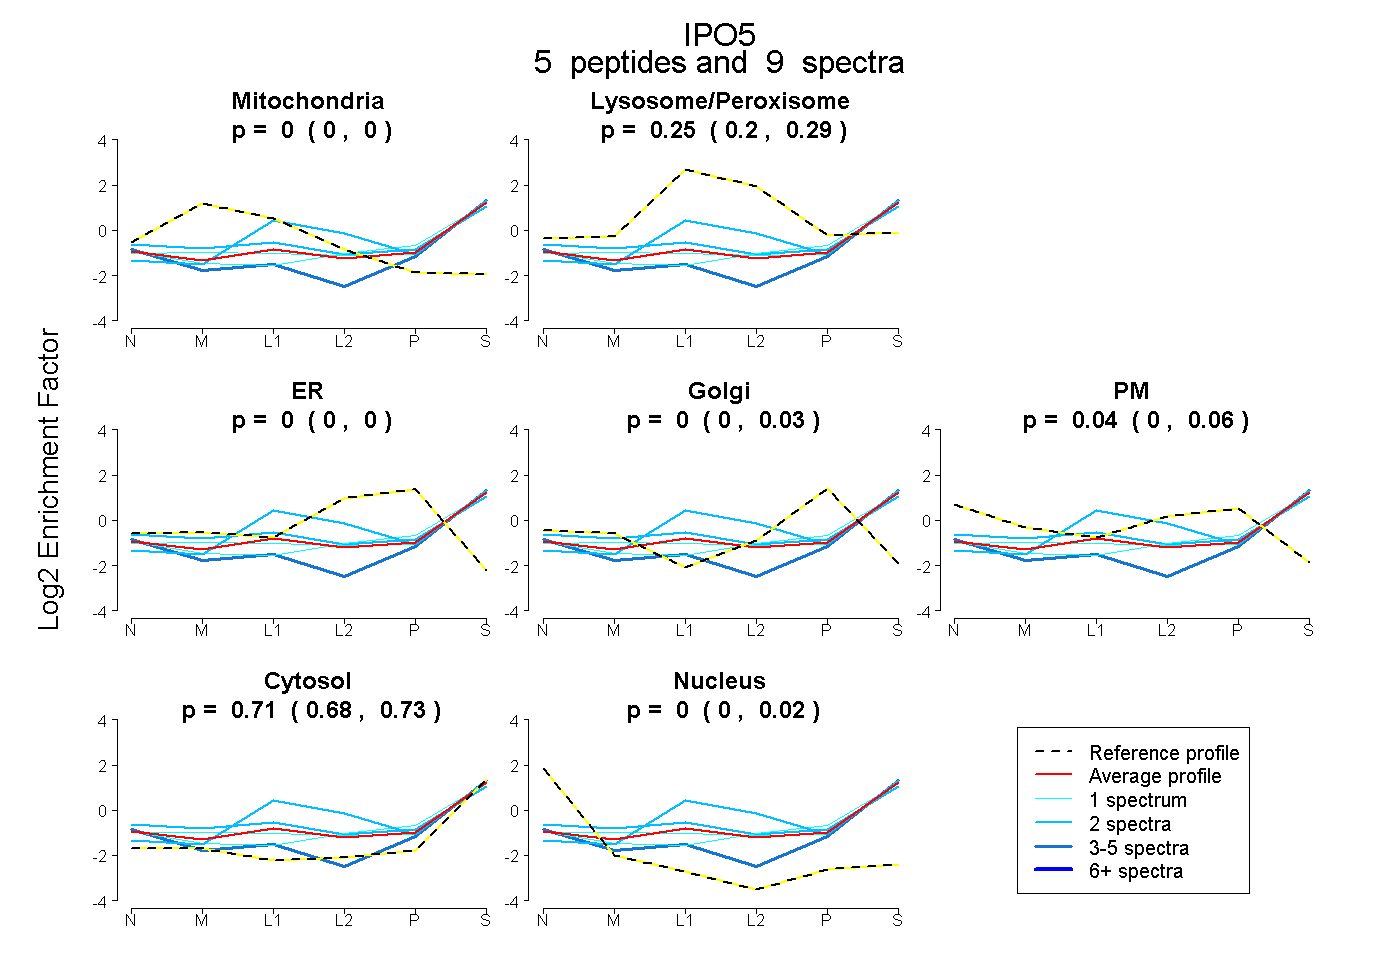 |
0.000 0.000 | 0.000 |
0.250 0.202 | 0.295 |
0.000 0.000 | 0.000 |
0.000 0.000 | 0.029 |
0.038 0.000 | 0.062 |
0.712 0.682 | 0.729 |
0.000 0.000 | 0.022 |
|||
| Plot | Lyso | Other | |||||||||||
| Expt C |
17 peptides |
50 spectra |
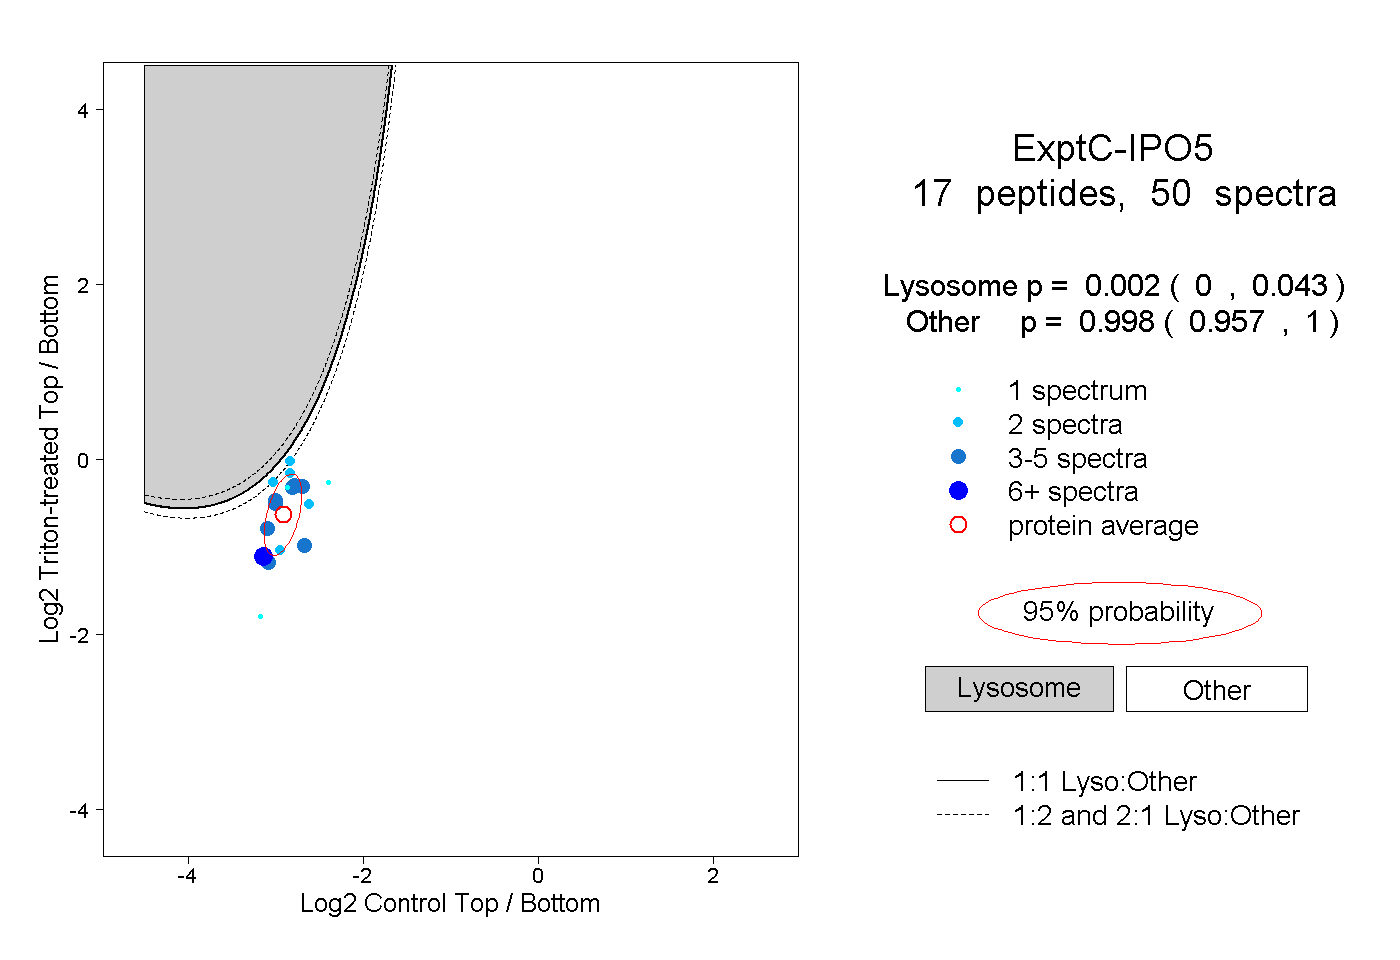 |
0.002 0.000 | 0.043 |
0.998 0.957 | 1.000 |
||||||||
| Plot | Lyso | Other | |||||||||||
| Expt D |
1 peptide |
2 spectra |
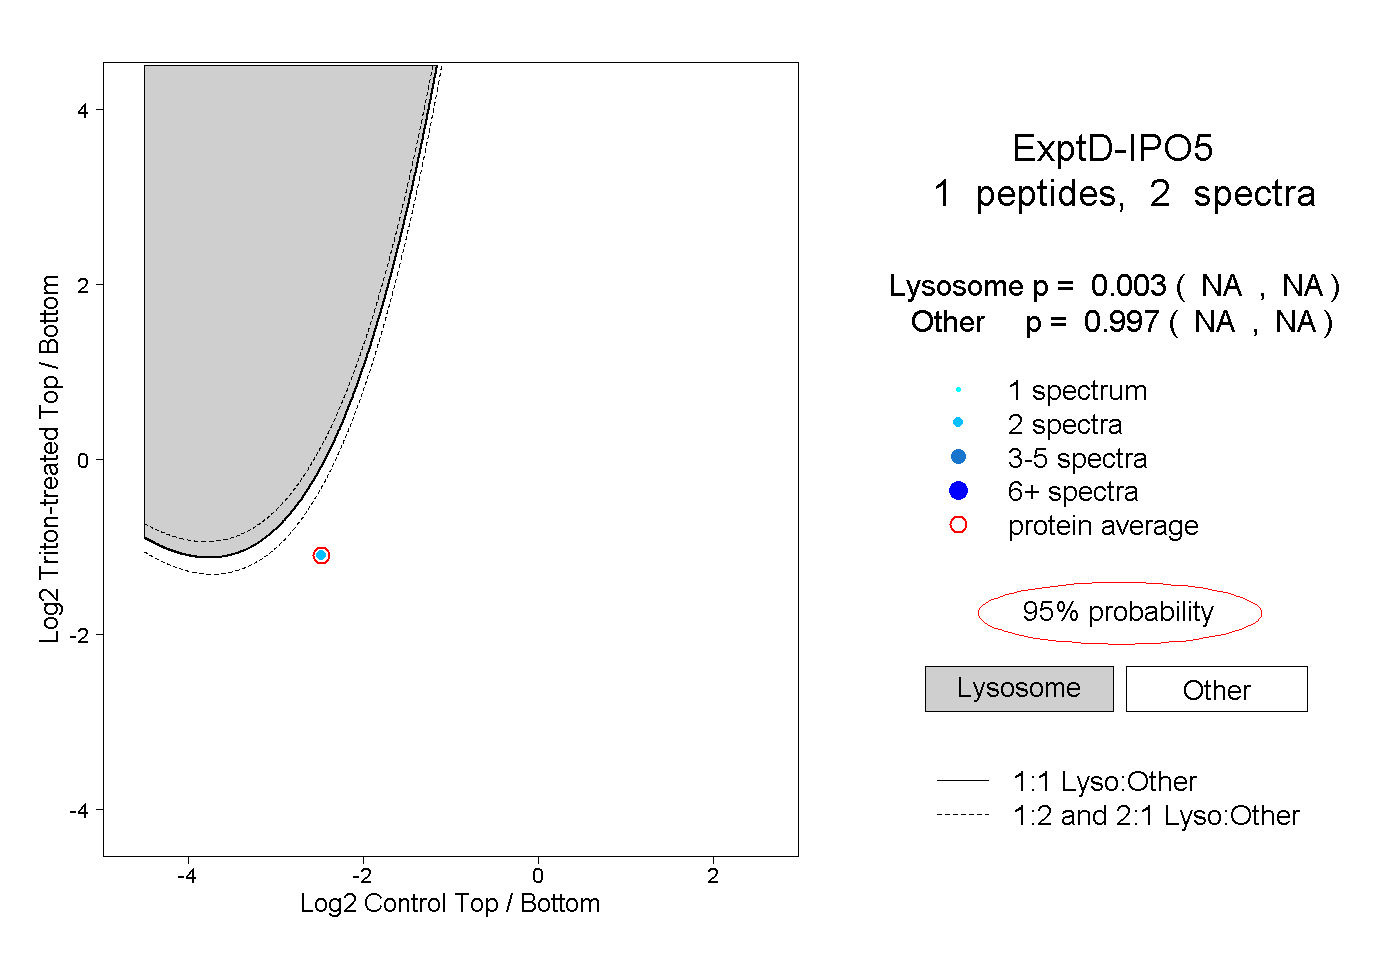 |
0.003 NA | NA |
0.997 NA | NA |