 4
4peptides
spectra
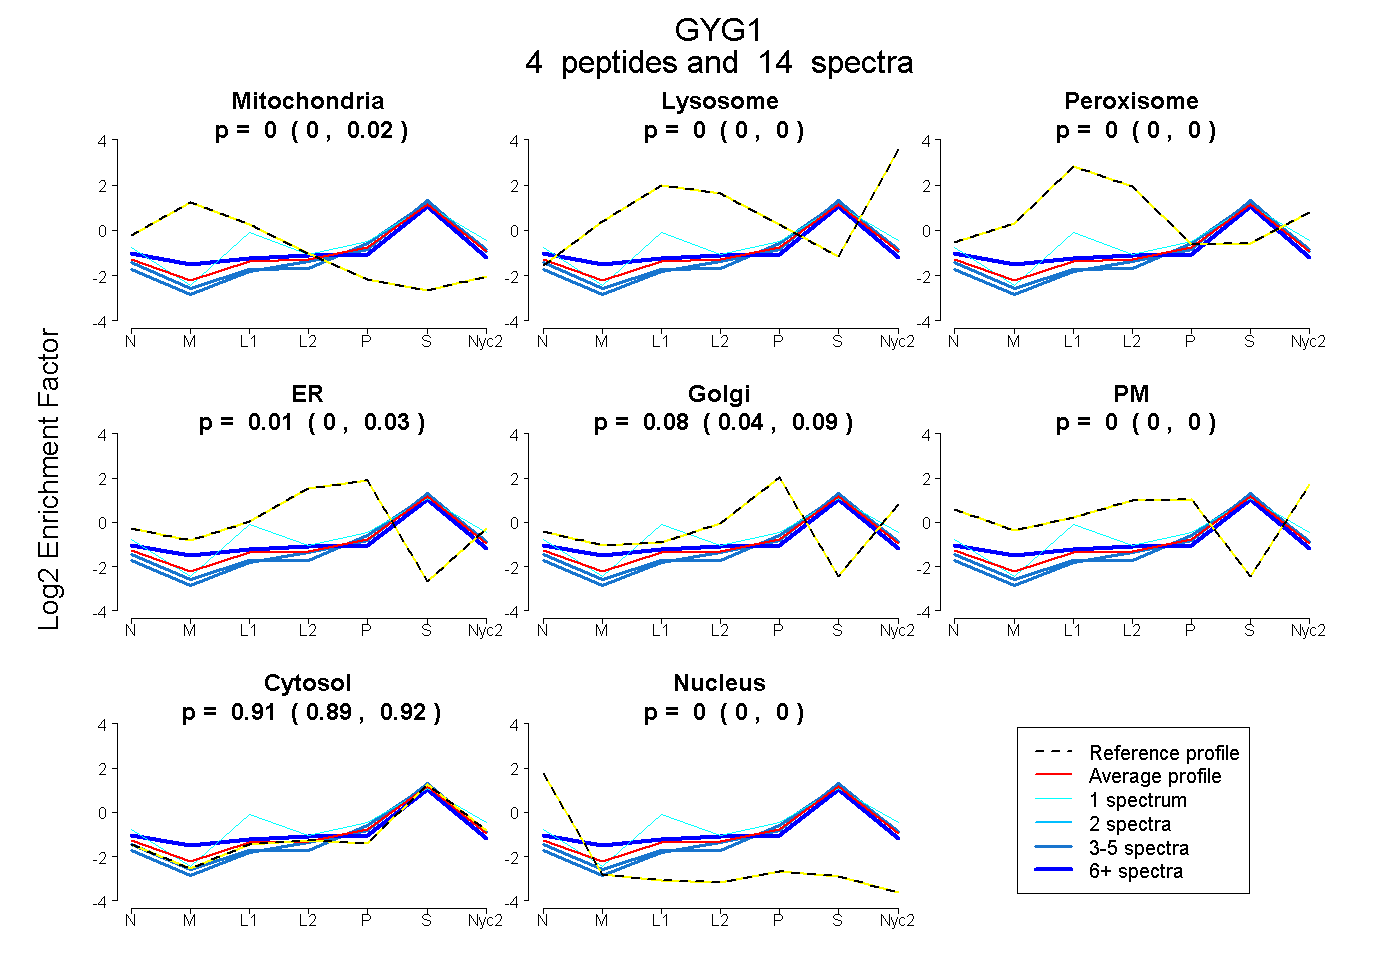
0.000 | 0.016
0.000 | 0.000
0.000 | 0.000
0.000 | 0.035
0.042 | 0.094
0.000 | 0.000
0.894 | 0.923
0.000 | 0.004
1peptide
spectra
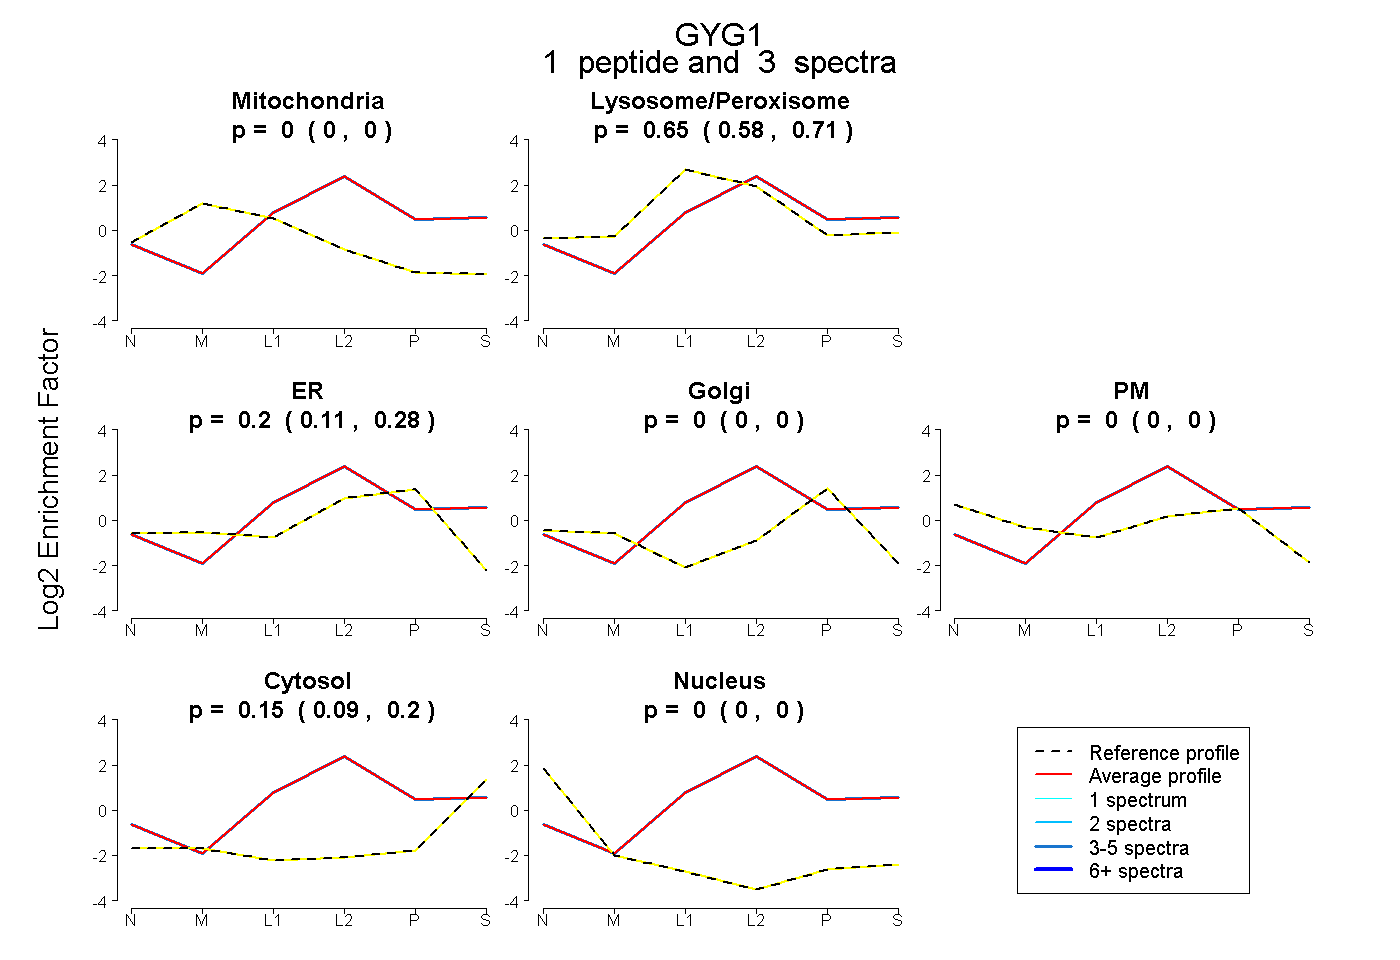
0.000 | 0.000
0.582 | 0.710
0.111 | 0.280
0.000 | 0.000
0.000 | 0.000
0.091 | 0.195
0.000 | 0.000
3peptides
spectra
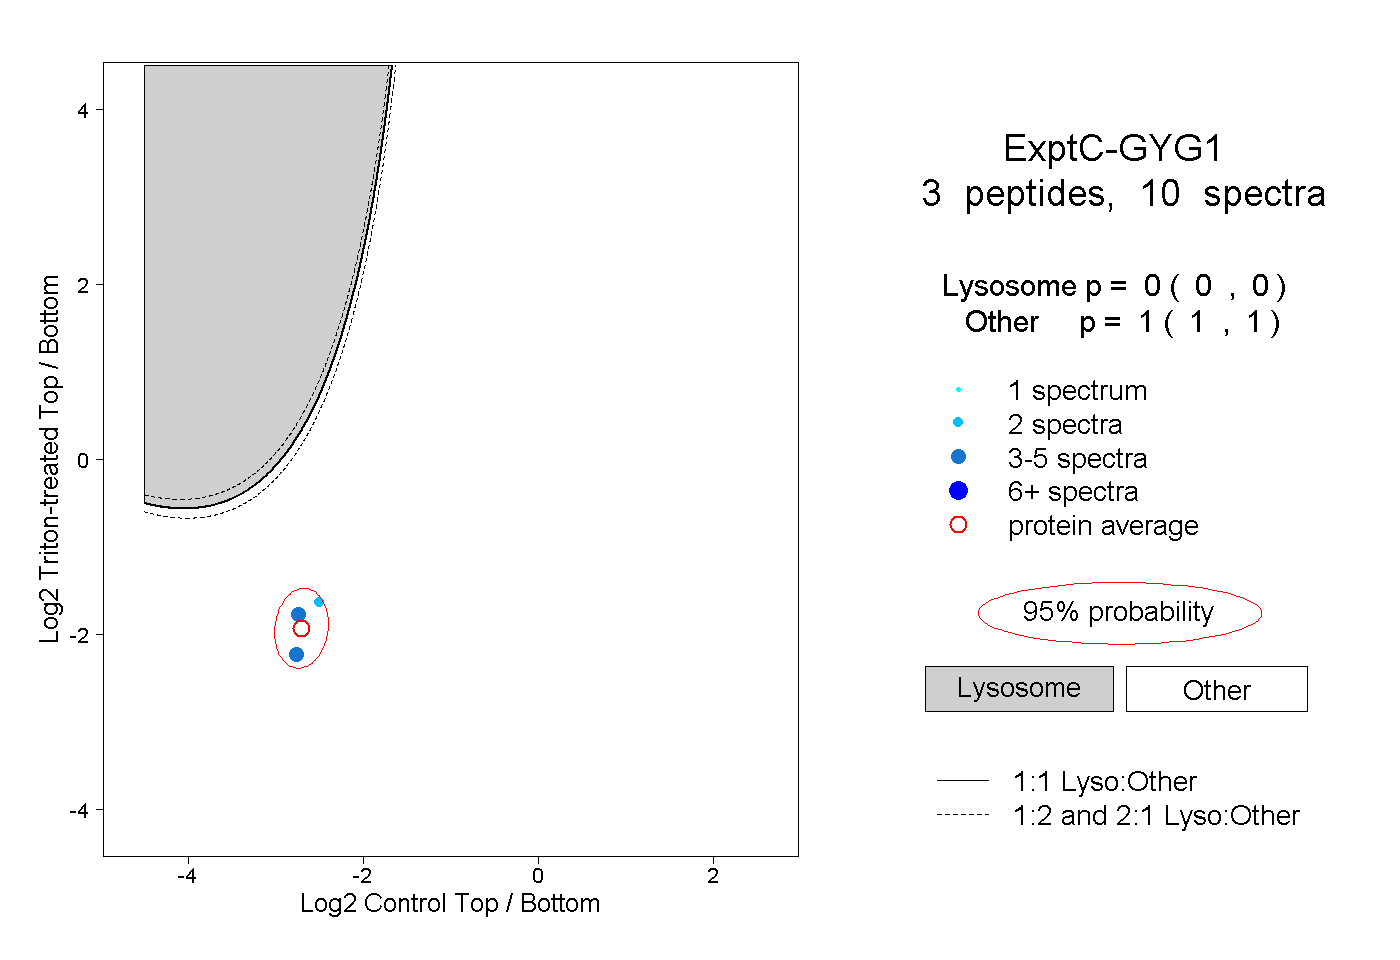
0.000 | 0.000
1.000 | 1.000
1peptide
spectra
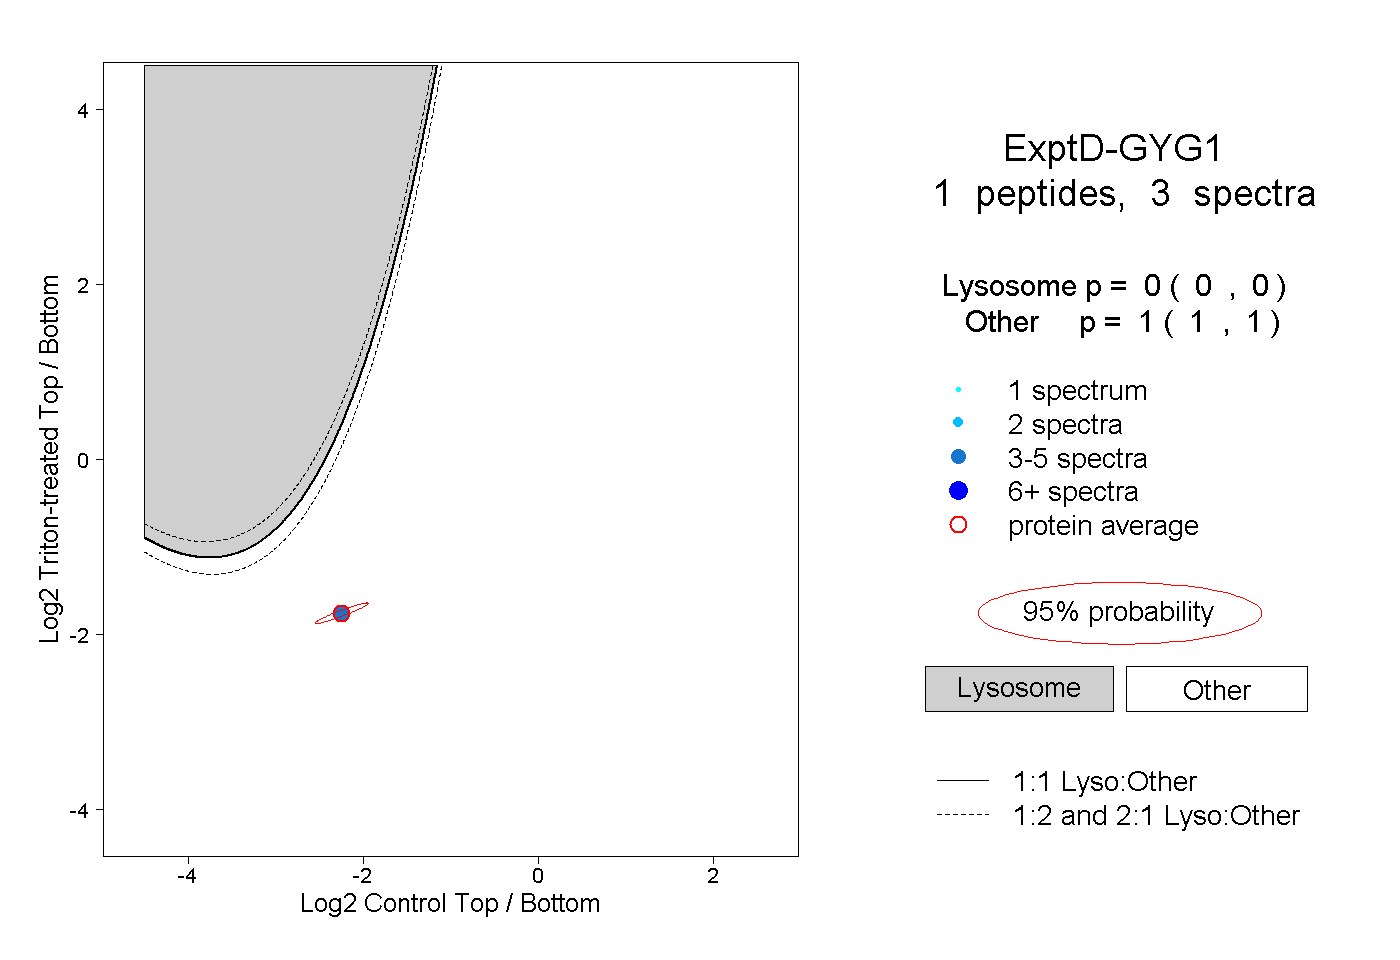
0.000 | 0.000
1.000 | 1.000