 4
4peptides
spectra
0.000 | 0.016
0.000 | 0.000
0.000 | 0.000
0.000 | 0.035
0.042 | 0.094
0.000 | 0.000
0.894 | 0.923
0.000 | 0.004
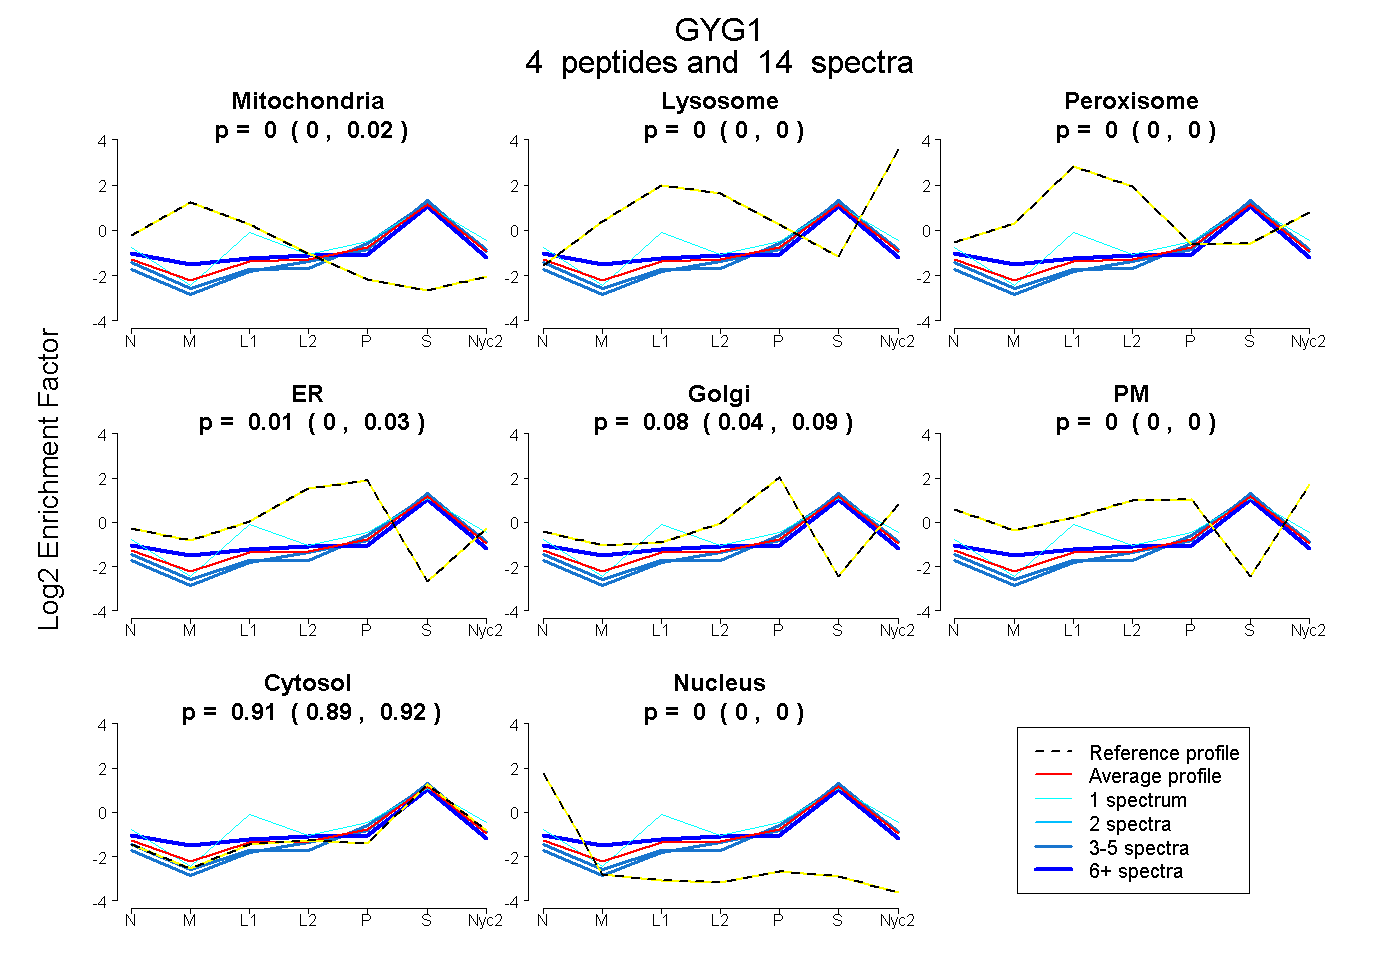
| Plot | Mito | Lyso | Perox | ER | Golgi | PM | Cytosol | Nucleus | |||||
| Expt A |
4 peptides |
14 spectra |
|
0.000 0.000 | 0.016 |
0.000 0.000 | 0.000 |
0.000 0.000 | 0.000 |
0.005 0.000 | 0.035 |
0.082 0.042 | 0.094 |
0.000 0.000 | 0.000 |
0.912 0.894 | 0.923 |
0.000 0.000 | 0.004 |
| 3 spectra, RPELGITLTK | 0.000 | 0.000 | 0.000 | 0.000 | 0.061 | 0.000 | 0.939 | 0.001 | ||
| 3 spectra, GALVLGSSLK | 0.000 | 0.000 | 0.000 | 0.000 | 0.016 | 0.000 | 0.984 | 0.000 | ||
| 7 spectra, VVHFLGR | 0.132 | 0.000 | 0.014 | 0.032 | 0.000 | 0.000 | 0.822 | 0.000 | ||
| 1 spectrum, WEQGQADYMGADSFDNIK | 0.000 | 0.000 | 0.170 | 0.000 | 0.065 | 0.000 | 0.765 | 0.000 |
| Plot | Mito | Lyso or Perox | ER | Golgi | PM | Cytosol | Nucleus | ||||||
| Expt B |
1 peptide |
3 spectra |
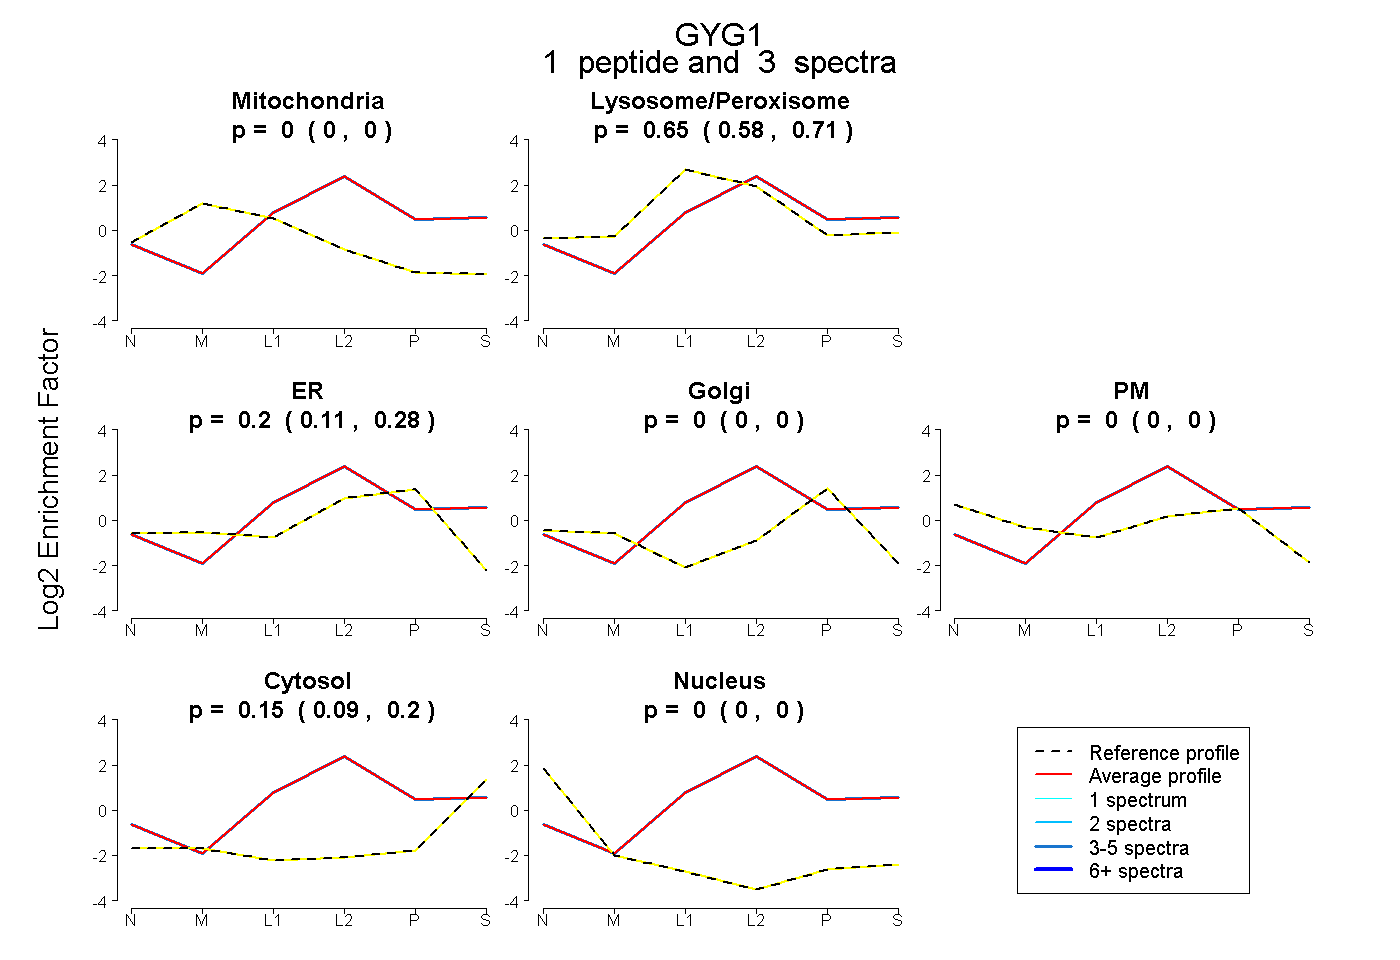 |
0.000 0.000 | 0.000 |
0.650 0.582 | 0.710 |
0.204 0.111 | 0.280 |
0.000 0.000 | 0.000 |
0.000 0.000 | 0.000 |
0.145 0.091 | 0.195 |
0.000 0.000 | 0.000 |
|||
| Plot | Lyso | Other | |||||||||||
| Expt C |
3 peptides |
10 spectra |
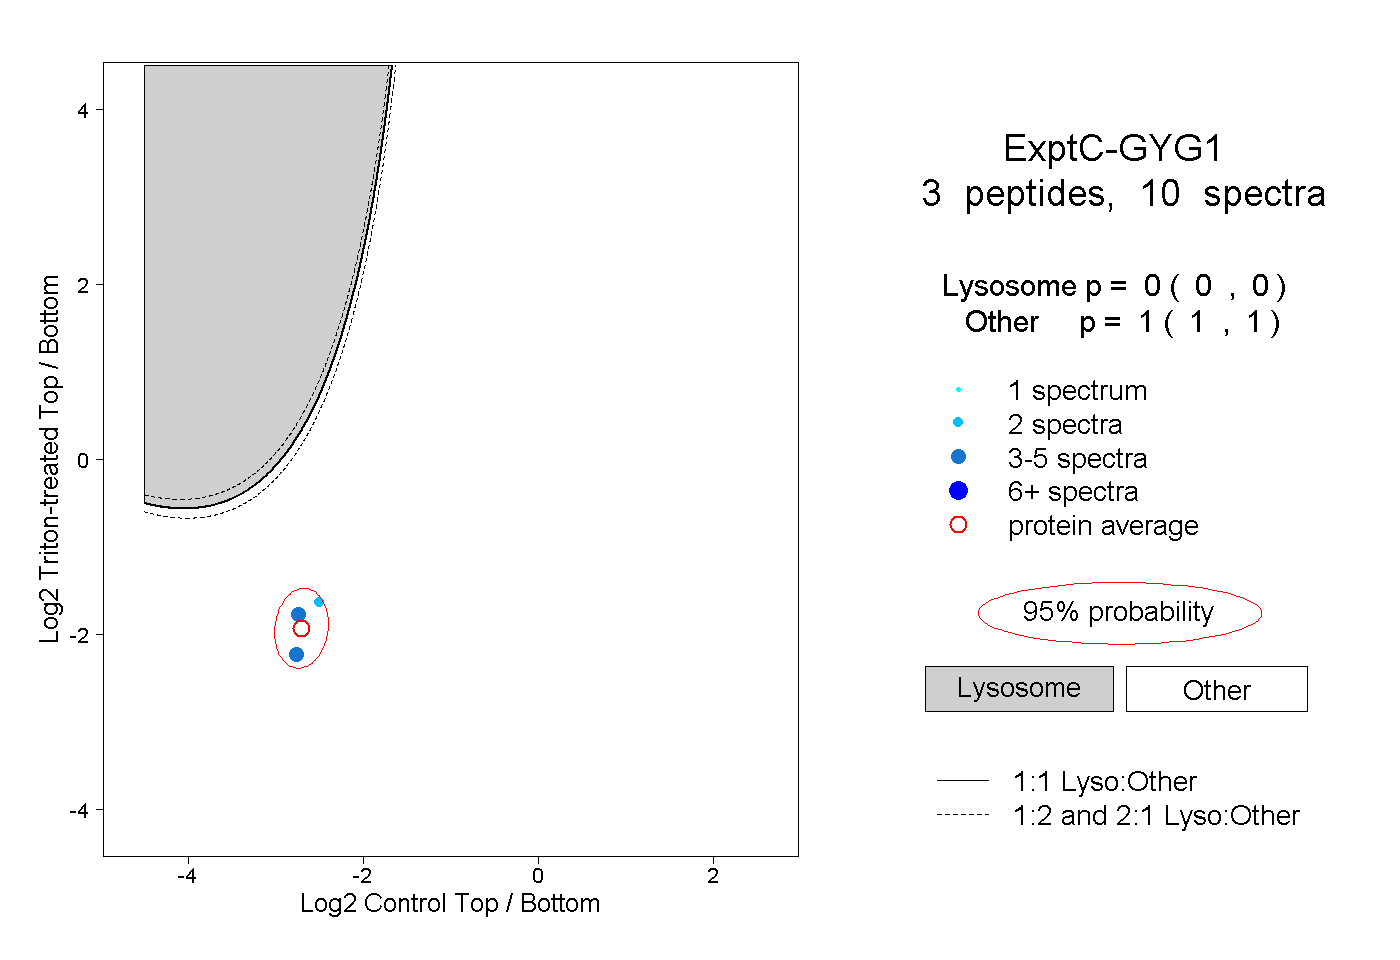 |
0.000 0.000 | 0.000 |
1.000 1.000 | 1.000 |
||||||||
| Plot | Lyso | Other | |||||||||||
| Expt D |
1 peptide |
3 spectra |
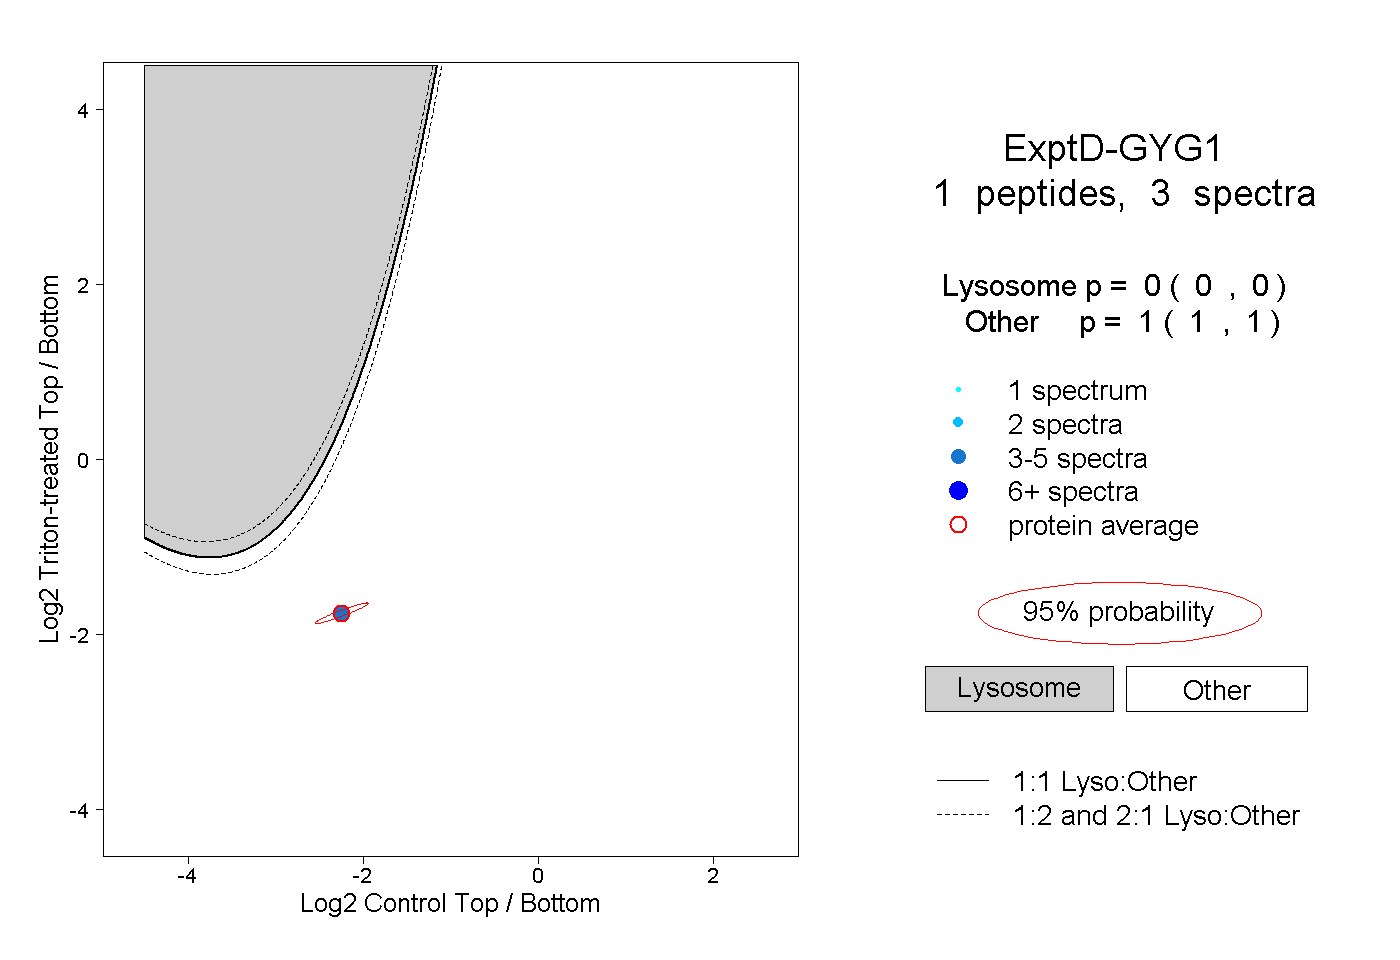 |
0.000 0.000 | 0.000 |
1.000 1.000 | 1.000 |