 6
6peptides
spectra
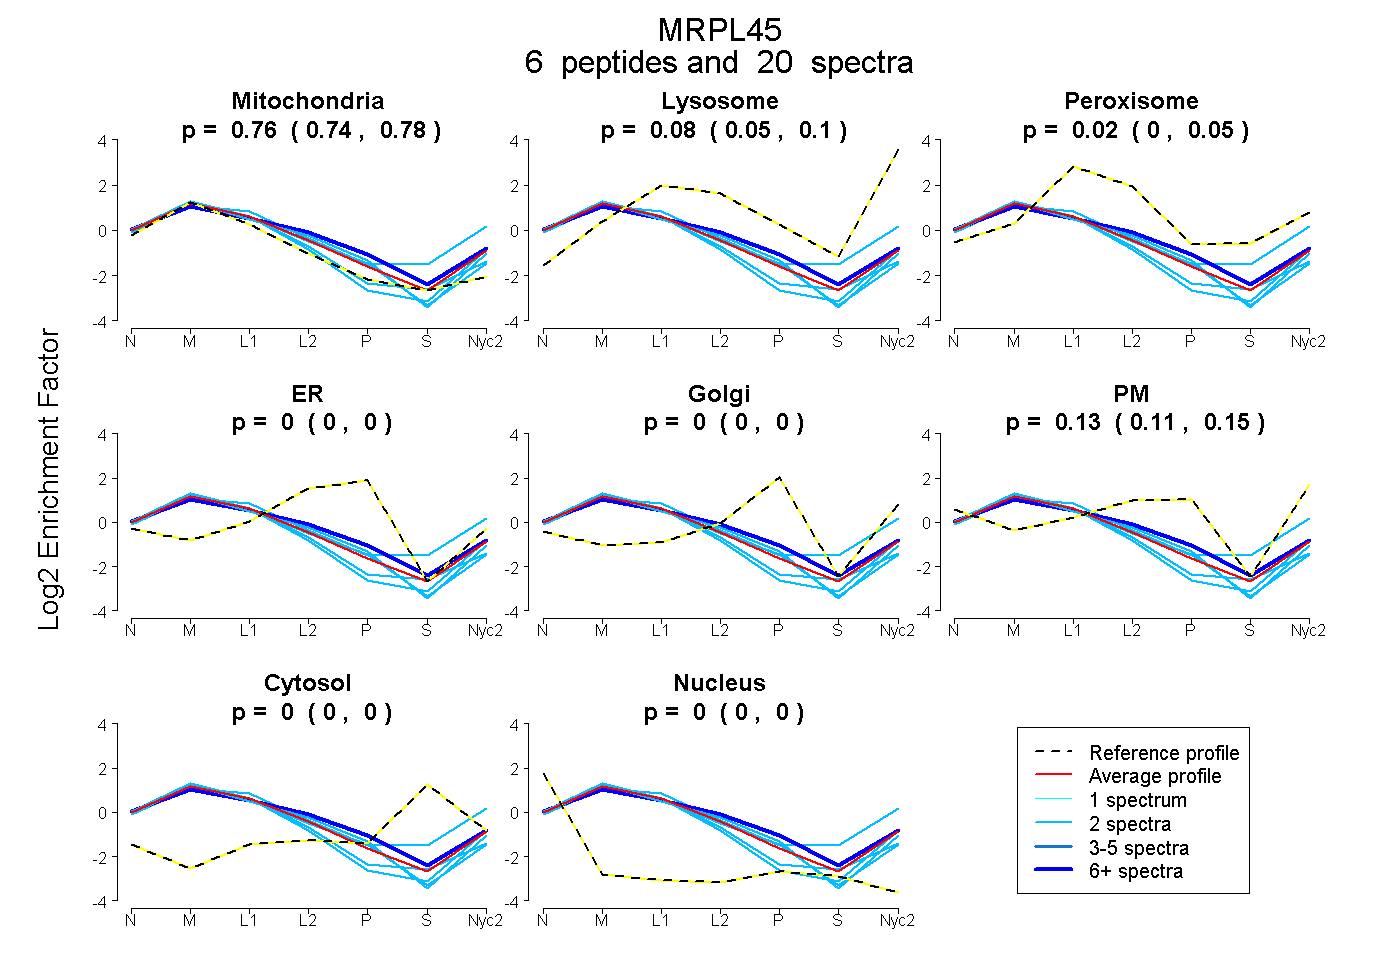
0.744 | 0.775
0.052 | 0.103
0.000 | 0.047
0.000 | 0.000
0.000 | 0.000
0.109 | 0.154
0.000 | 0.000
0.000 | 0.000
3peptides
spectra
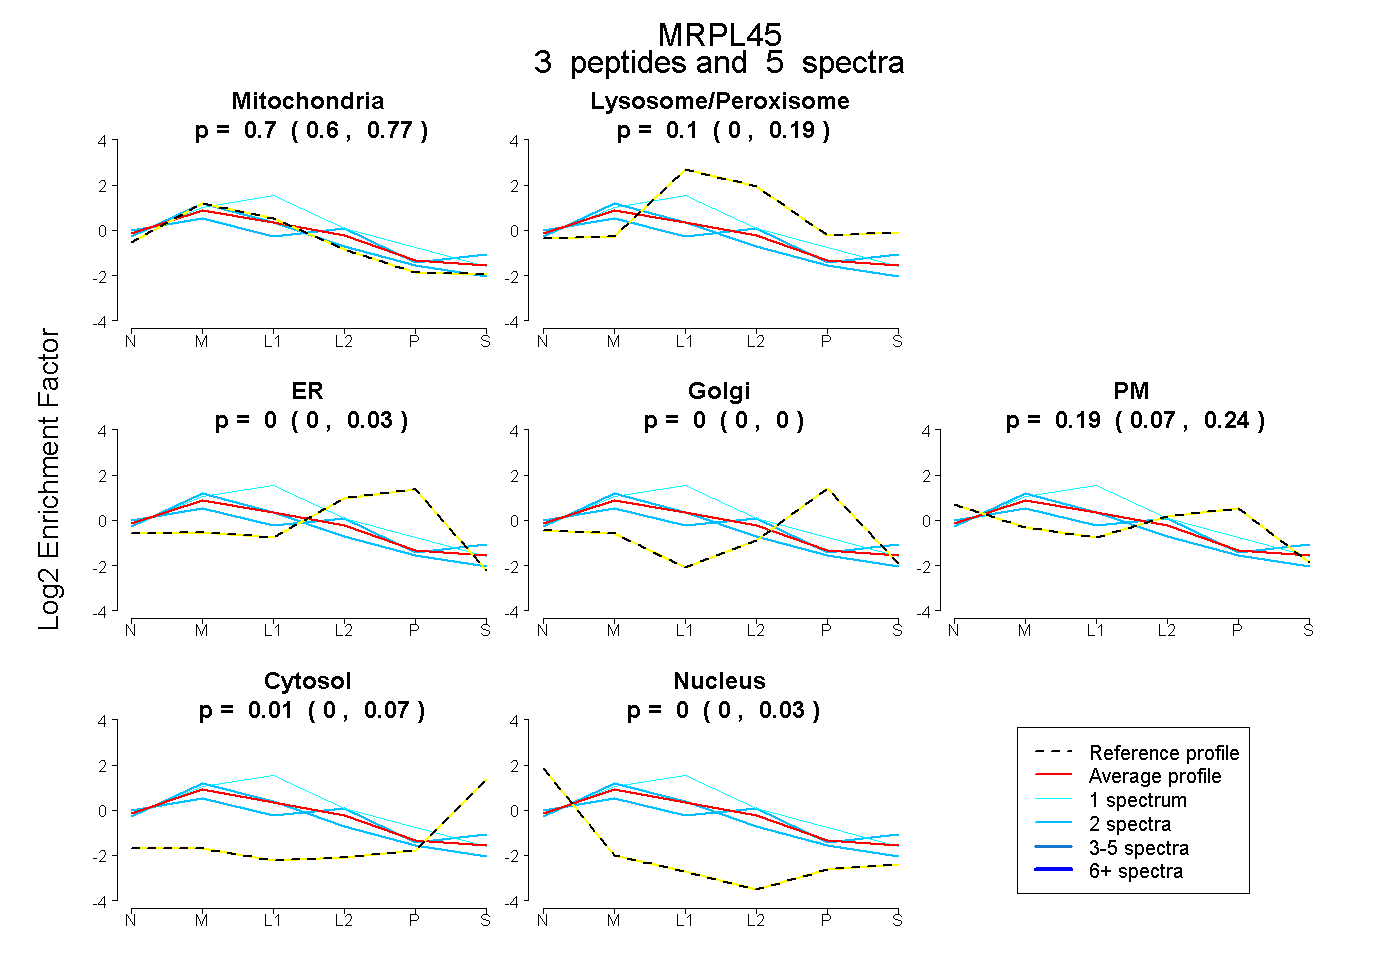
0.597 | 0.770
0.000 | 0.190
0.000 | 0.032
0.000 | 0.000
0.071 | 0.245
0.000 | 0.070
0.000 | 0.035
9peptides
spectra
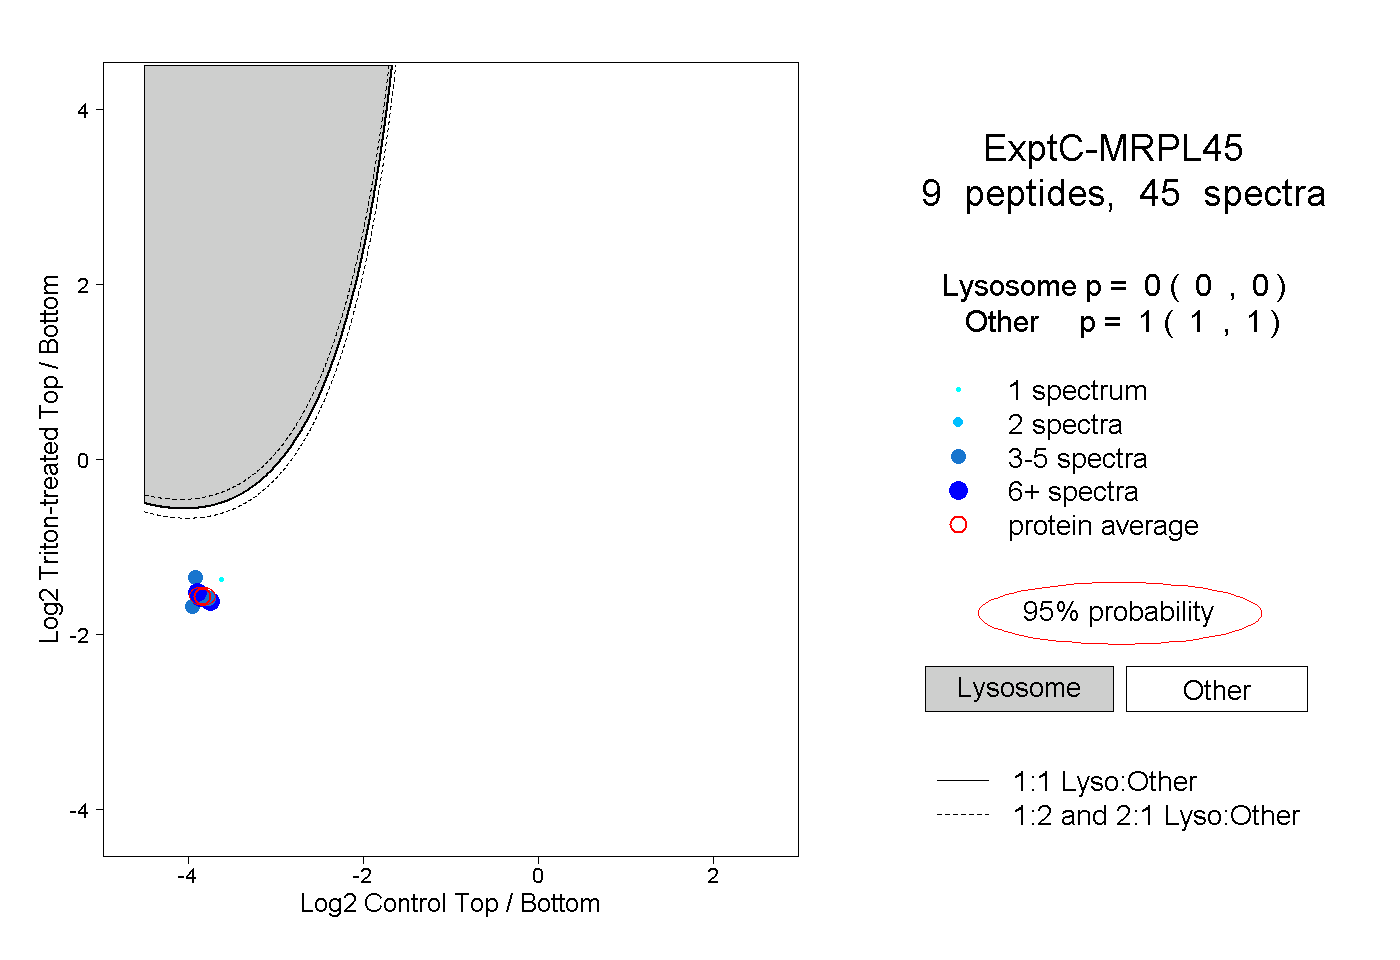
0.000 | 0.000
1.000 | 1.000