 6
6peptides
spectra
0.744 | 0.775
0.052 | 0.103
0.000 | 0.047
0.000 | 0.000
0.000 | 0.000
0.109 | 0.154
0.000 | 0.000
0.000 | 0.000
| Plot | Mito | Lyso | Perox | ER | Golgi | PM | Cytosol | Nucleus | |||||
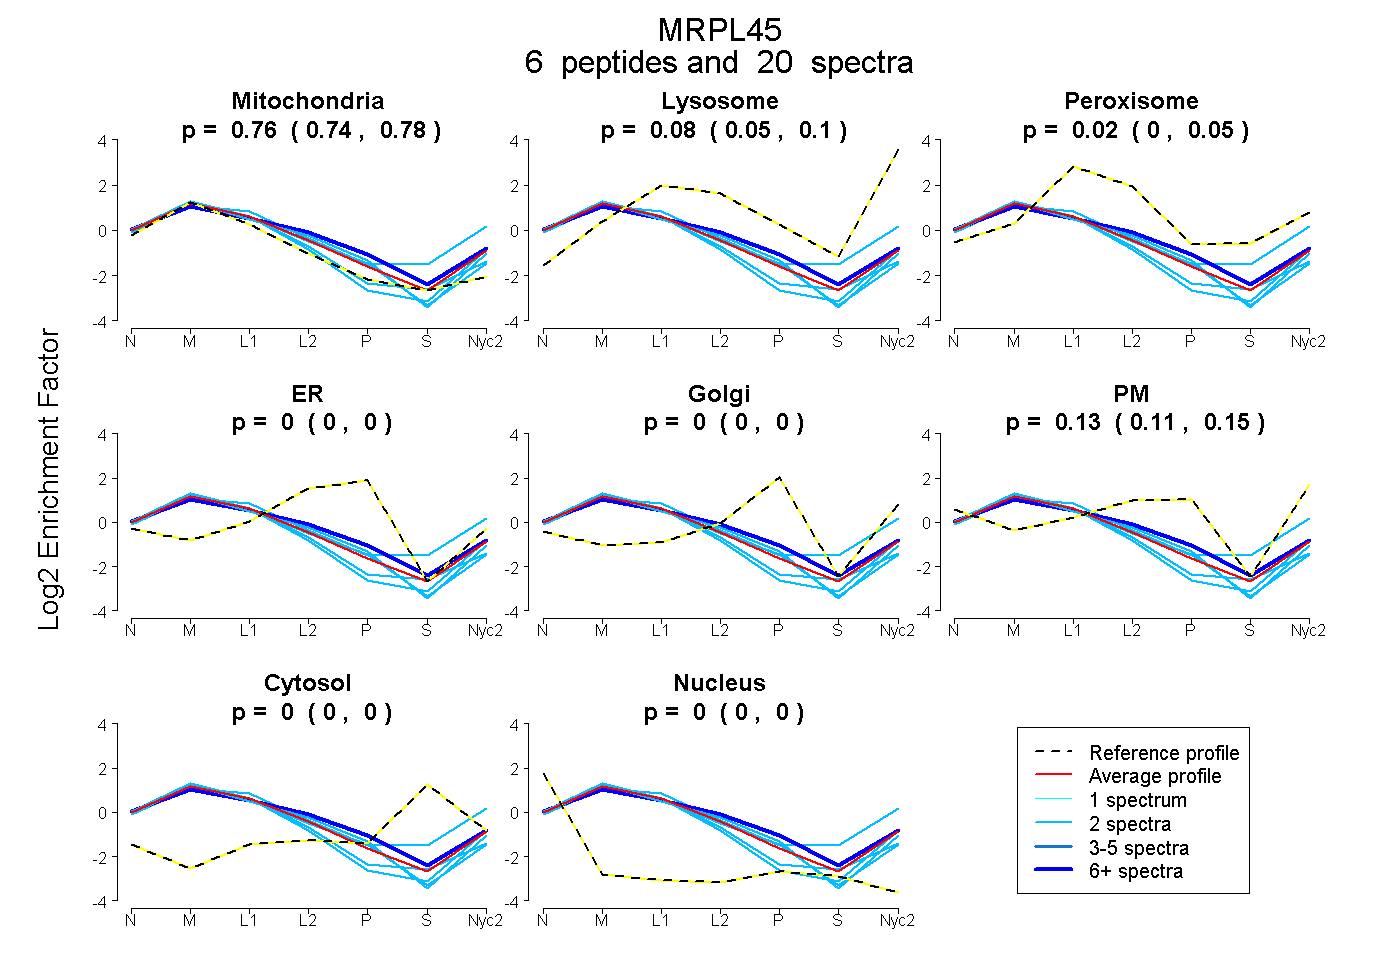
| Expt A |
6 peptides |
20 spectra |
|
0.761 0.744 | 0.775 |
0.081 0.052 | 0.103 |
0.025 0.000 | 0.047 |
0.000 0.000 | 0.000 |
0.000 0.000 | 0.000 |
0.134 0.109 | 0.154 |
0.000 0.000 | 0.000 |
0.000 0.000 | 0.000 |
| 2 spectra, QTLAIYDR | 0.815 | 0.000 | 0.000 | 0.043 | 0.000 | 0.143 | 0.000 | 0.000 | ||
| 2 spectra, EFLEYAR | 0.892 | 0.037 | 0.071 | 0.000 | 0.000 | 0.000 | 0.000 | 0.000 | ||
| 2 spectra, AGLVIPQER | 0.576 | 0.299 | 0.076 | 0.000 | 0.000 | 0.000 | 0.033 | 0.016 | ||
| 2 spectra, NVASQLAIR | 0.745 | 0.001 | 0.000 | 0.011 | 0.000 | 0.243 | 0.000 | 0.000 | ||
| 10 spectra, FRPPTR | 0.636 | 0.000 | 0.104 | 0.000 | 0.000 | 0.260 | 0.000 | 0.000 | ||
| 2 spectra, DVLEYVVFER | 0.891 | 0.109 | 0.000 | 0.000 | 0.000 | 0.000 | 0.000 | 0.000 |
| Plot | Mito | Lyso or Perox | ER | Golgi | PM | Cytosol | Nucleus | ||||||
| Expt B |
3 peptides |
5 spectra |
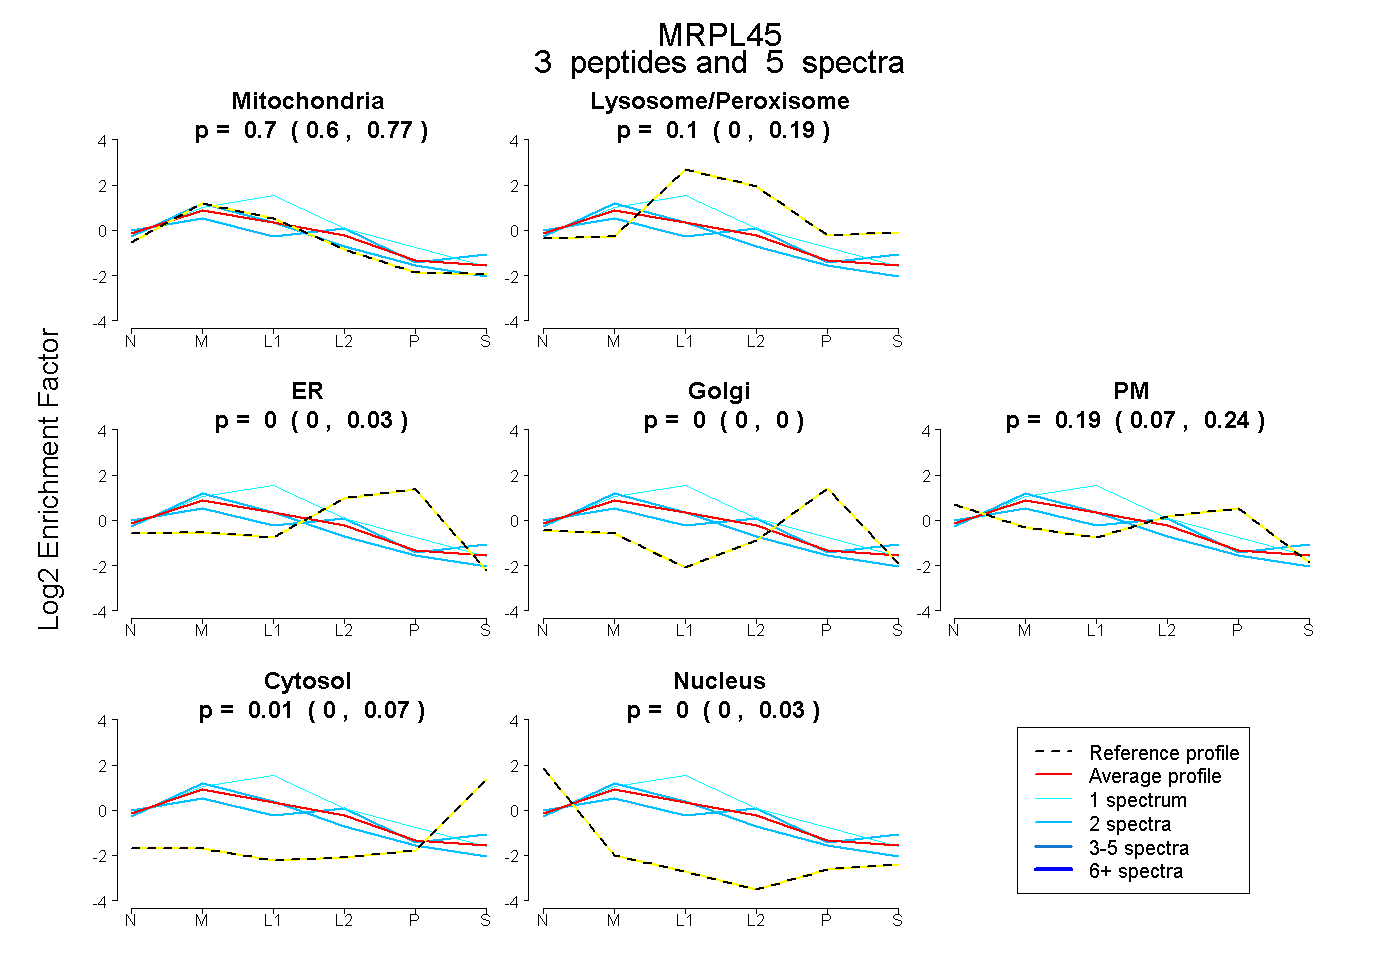 |
0.699 0.597 | 0.770 |
0.101 0.000 | 0.190 |
0.000 0.000 | 0.032 |
0.000 0.000 | 0.000 |
0.188 0.071 | 0.245 |
0.011 0.000 | 0.070 |
0.000 0.000 | 0.035 |
|||
| Plot | Lyso | Other | |||||||||||
| Expt C |
9 peptides |
45 spectra |
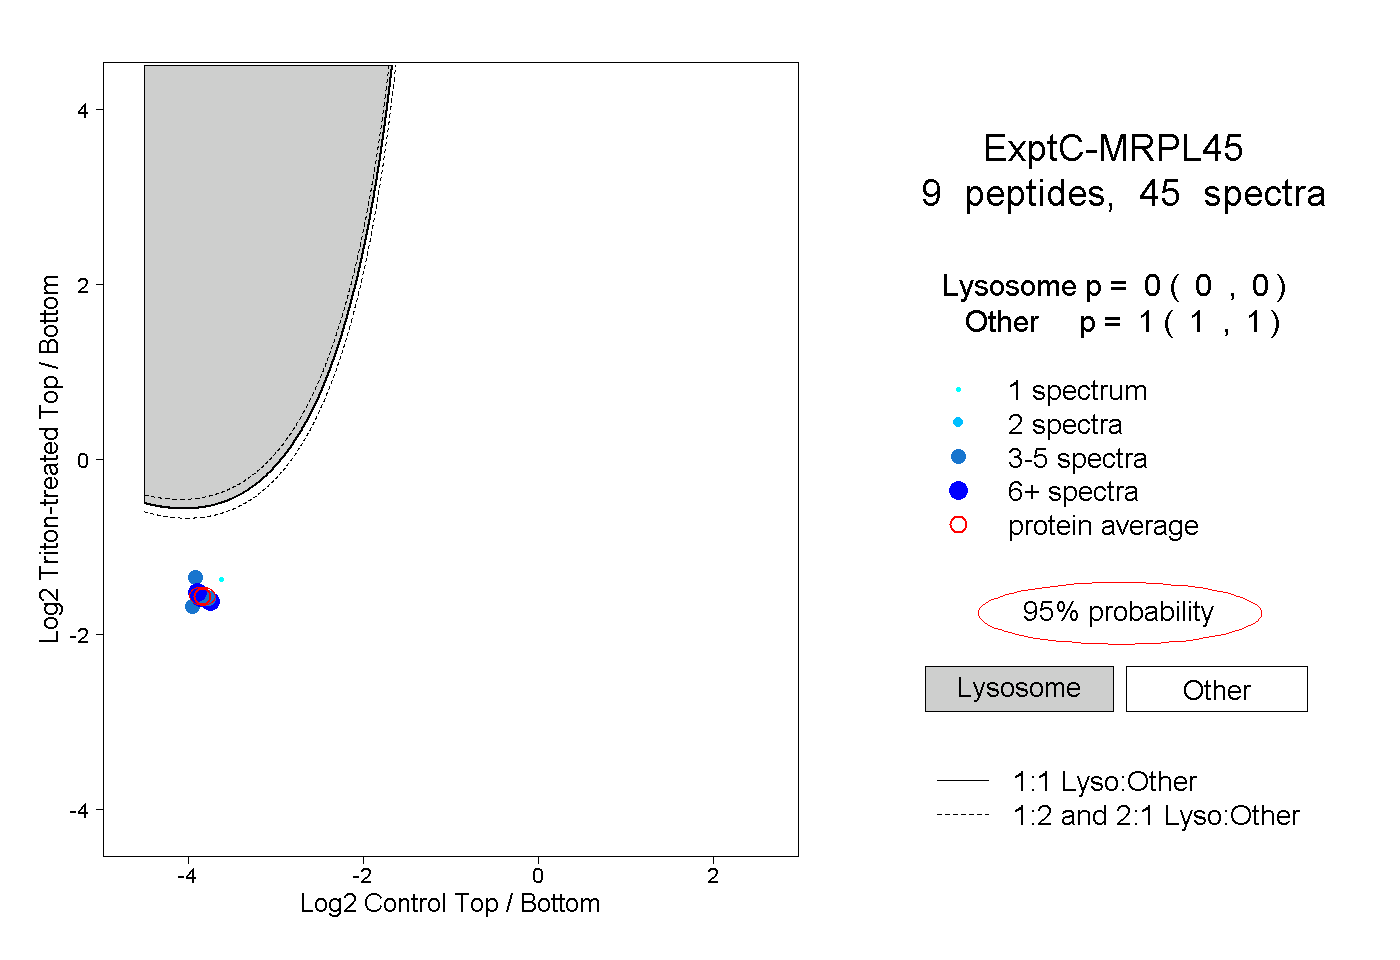 |
0.000 0.000 | 0.000 |
1.000 1.000 | 1.000 |