 11
11peptides
spectra
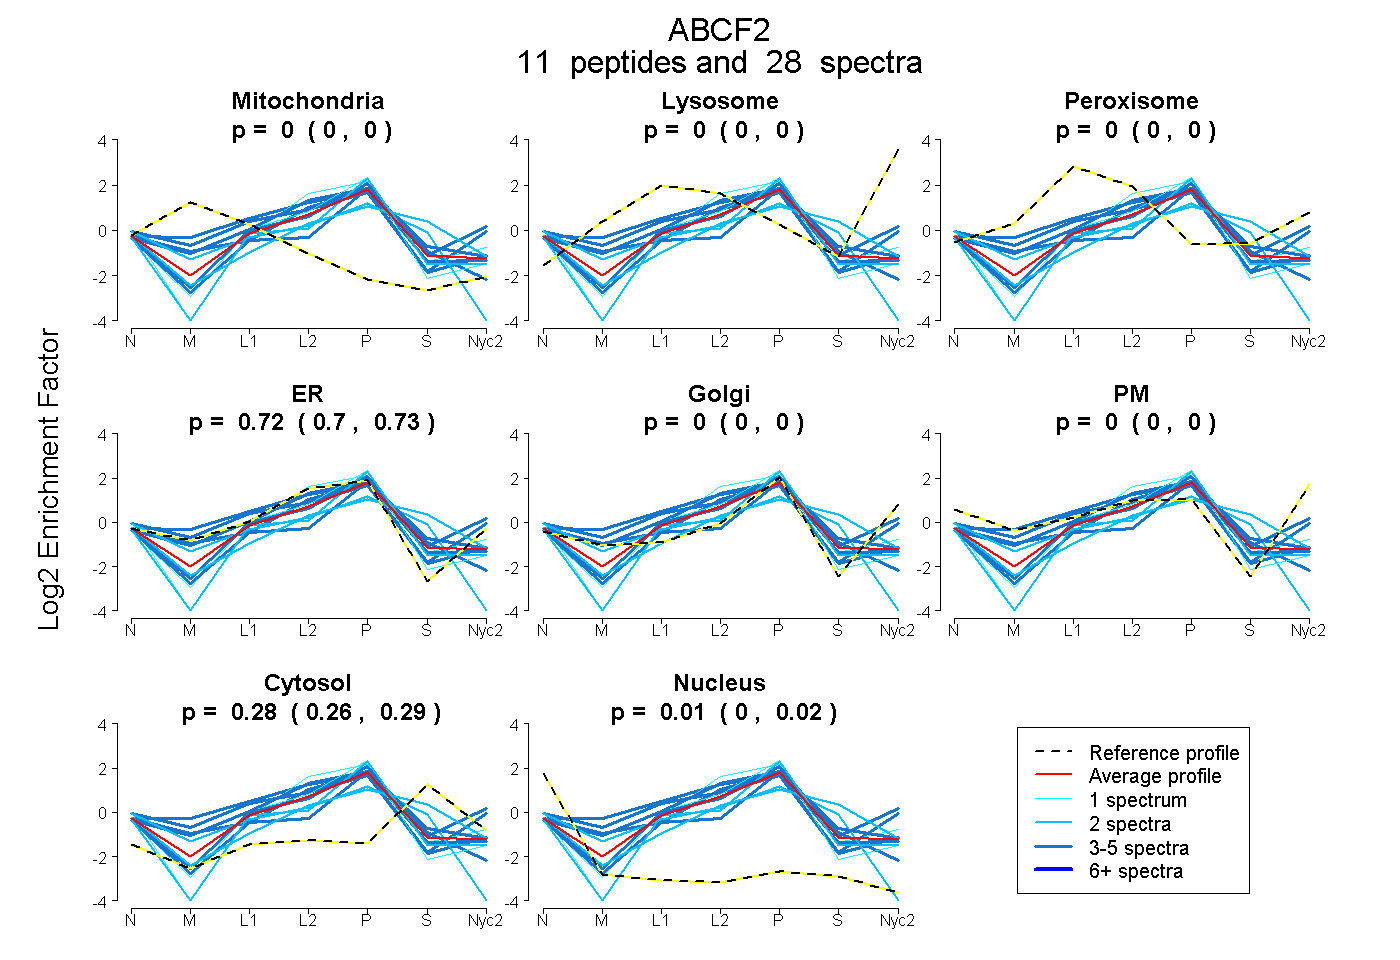
0.000 | 0.000
0.000 | 0.000
0.000 | 0.000
0.703 | 0.725
0.000 | 0.000
0.000 | 0.000
0.260 | 0.289
0.000 | 0.019
2peptides
spectra
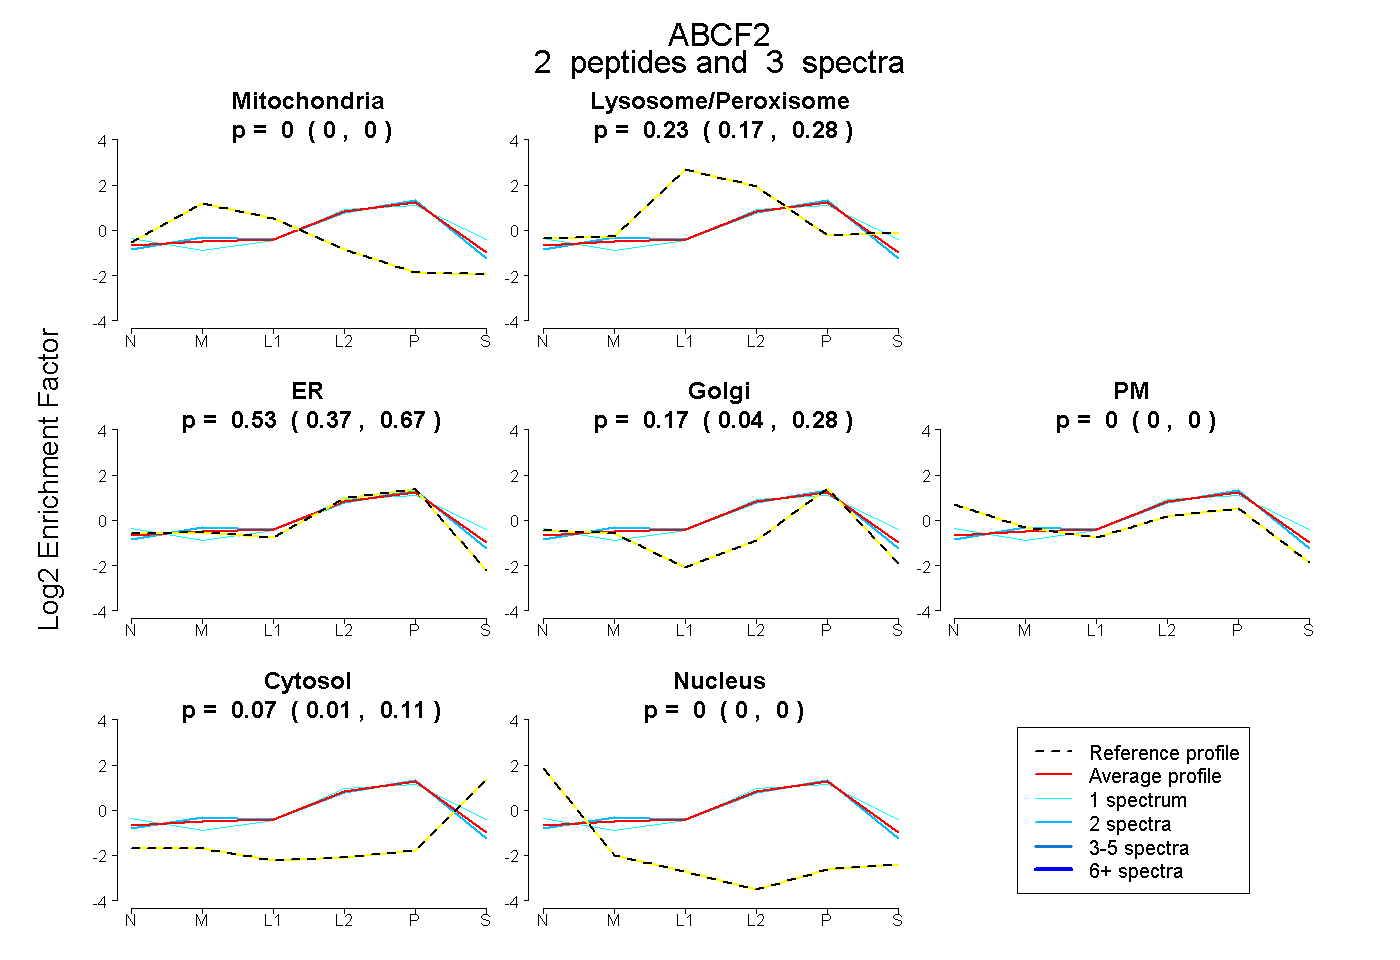
0.000 | 0.000
0.166 | 0.282
0.369 | 0.669
0.043 | 0.279
0.000 | 0.000
0.013 | 0.109
0.000 | 0.000
4peptides
spectra
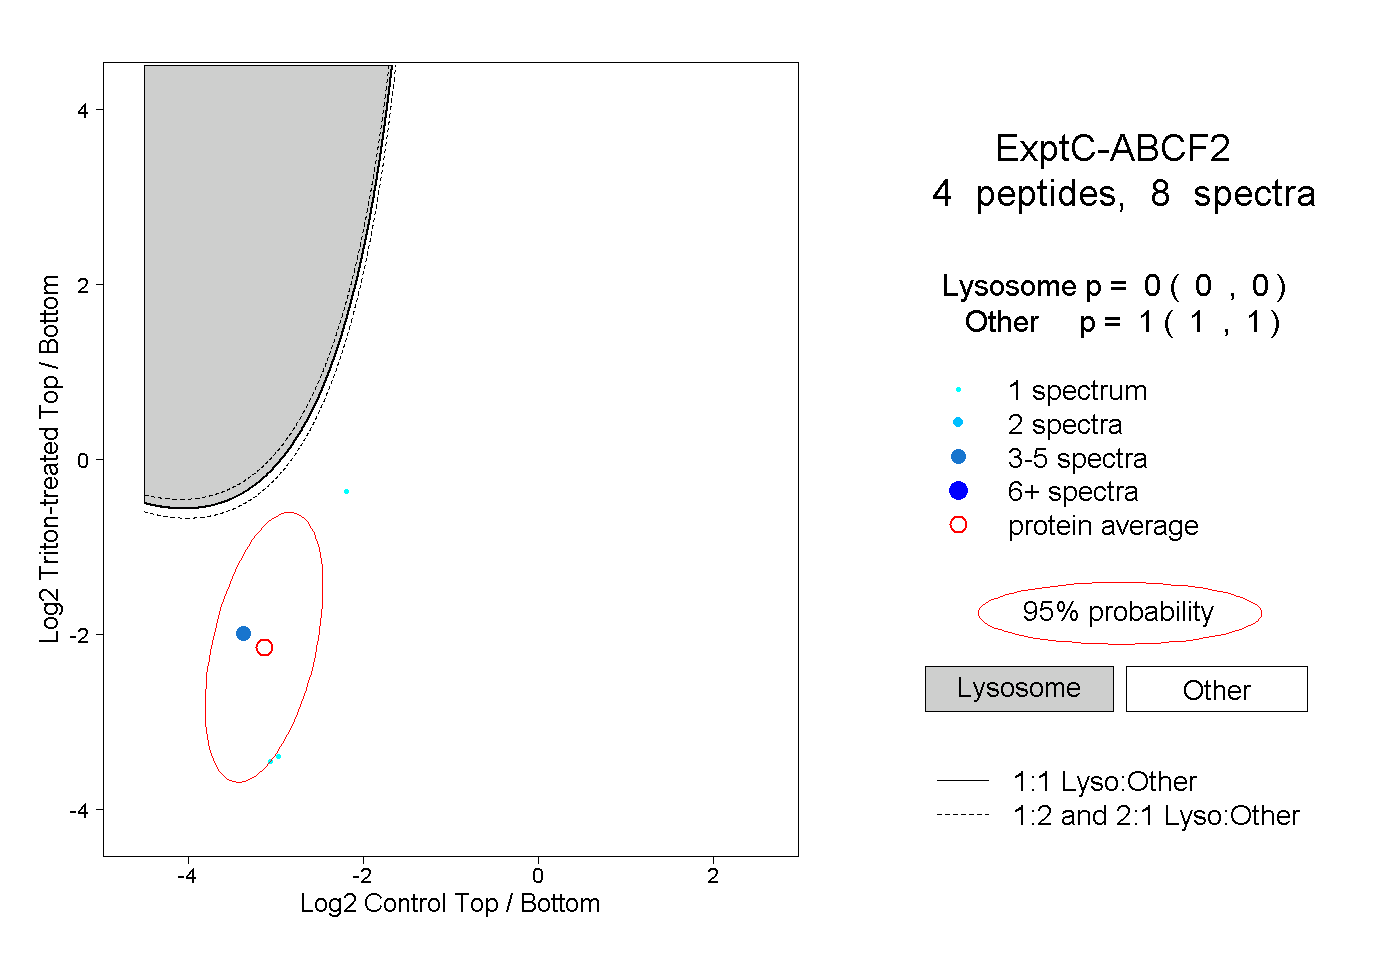
0.000 | 0.000
1.000 | 1.000
1peptide
spectrum
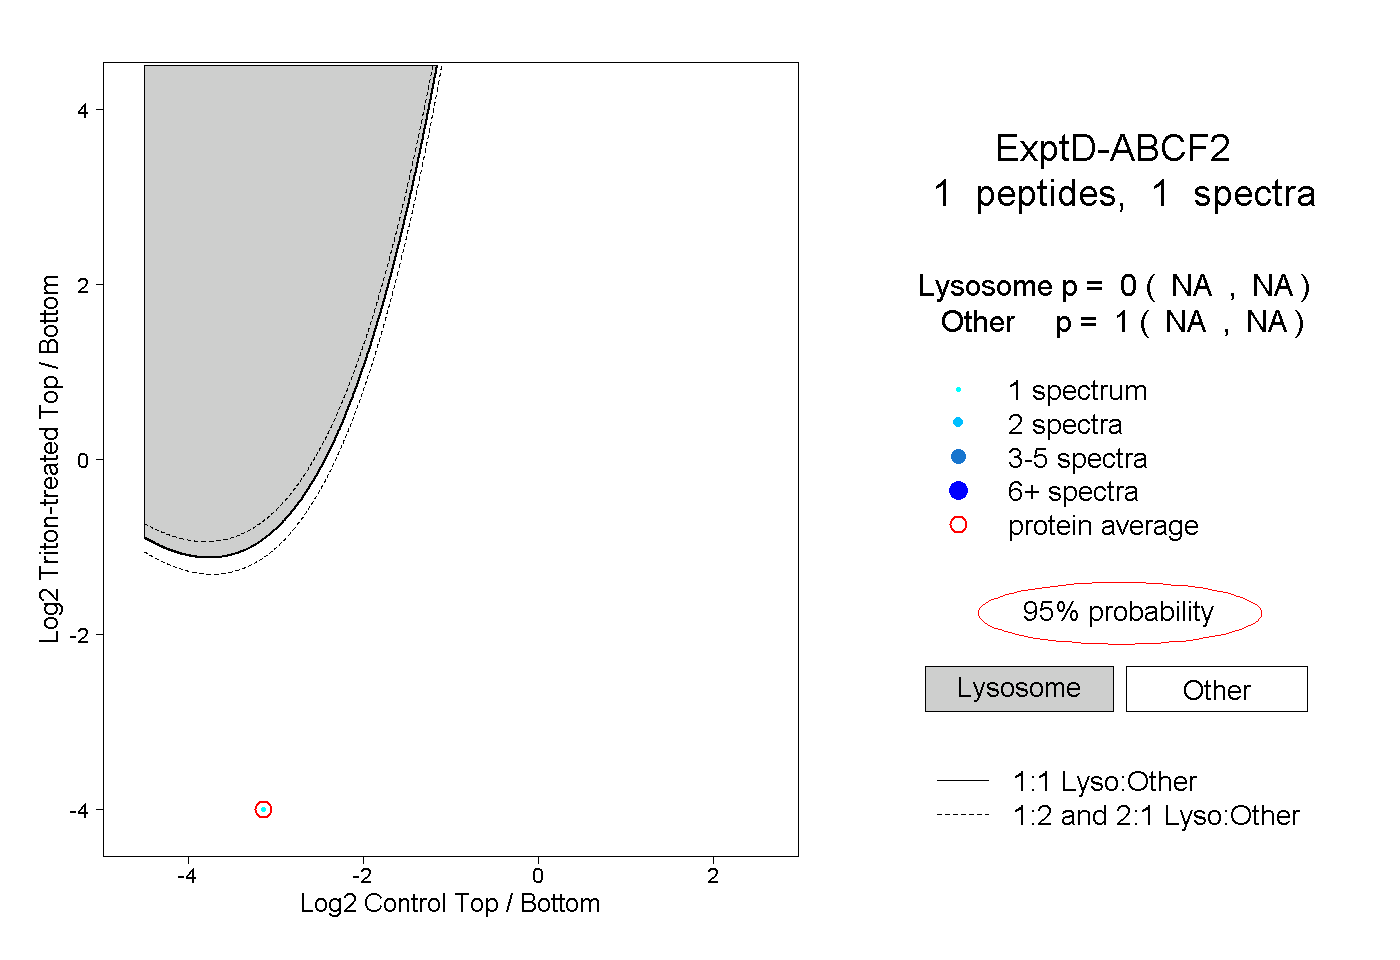
NA | NA
NA | NA