 11
11peptides
spectra
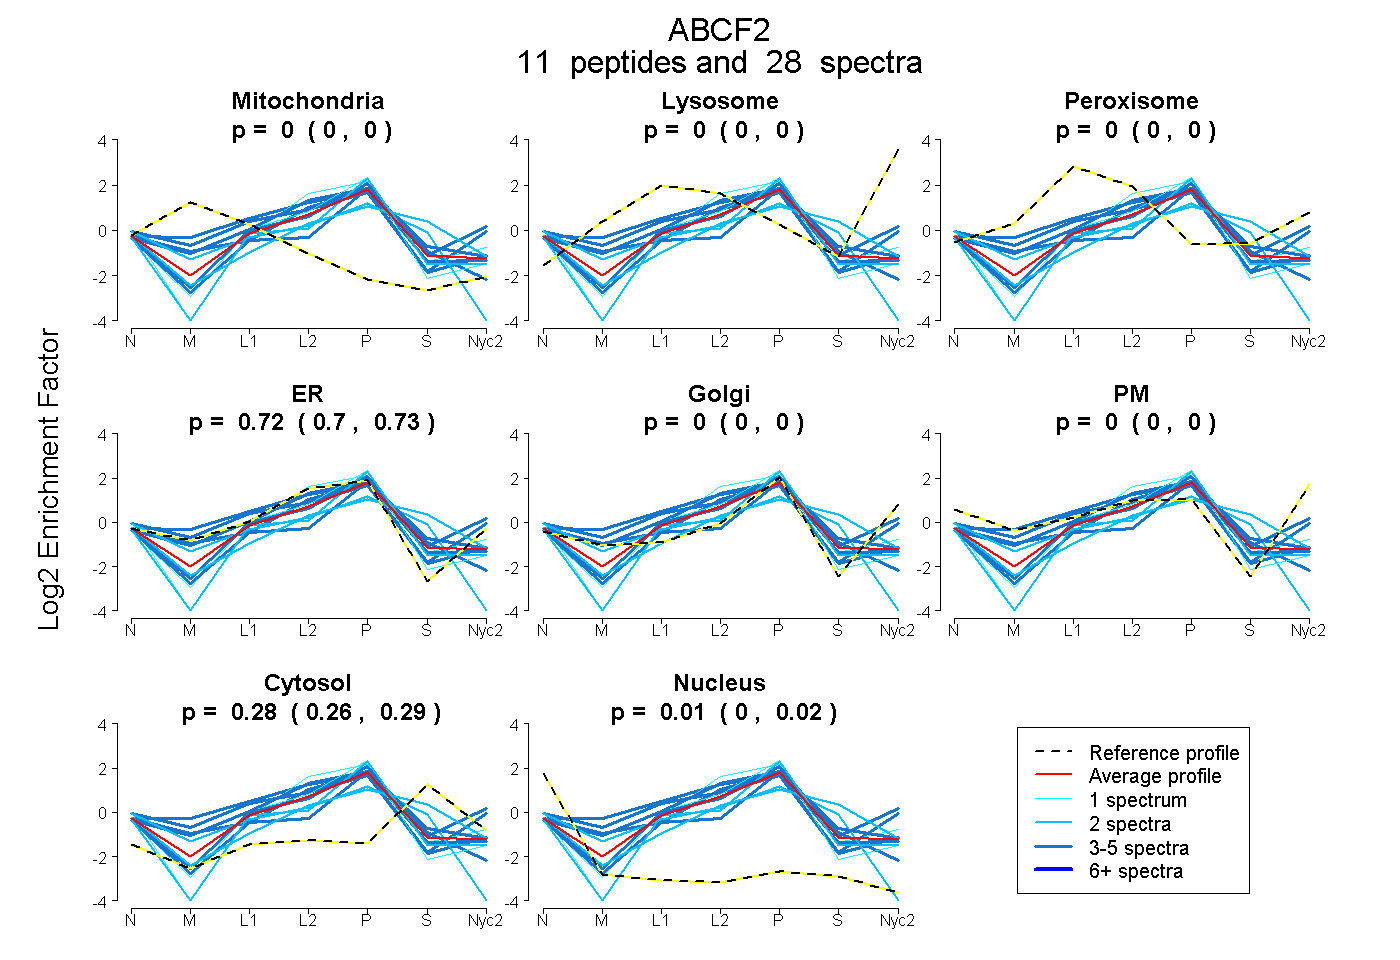
0.000 | 0.000
0.000 | 0.000
0.000 | 0.000
0.703 | 0.725
0.000 | 0.000
0.000 | 0.000
0.260 | 0.289
0.000 | 0.019
| Plot | Mito | Lyso | Perox | ER | Golgi | PM | Cytosol | Nucleus | |||||
| Expt A |
11 peptides |
28 spectra |
|
0.000 0.000 | 0.000 |
0.000 0.000 | 0.000 |
0.000 0.000 | 0.000 |
0.715 0.703 | 0.725 |
0.000 0.000 | 0.000 |
0.000 0.000 | 0.000 |
0.276 0.260 | 0.289 |
0.009 0.000 | 0.019 |
| 3 spectra, LEELDADK | 0.000 | 0.000 | 0.000 | 0.730 | 0.000 | 0.000 | 0.226 | 0.044 | ||
| 2 spectra, QQVSPIR | 0.000 | 0.000 | 0.000 | 0.441 | 0.000 | 0.000 | 0.559 | 0.000 | ||
| 3 spectra, LELEENQMK | 0.000 | 0.000 | 0.000 | 0.830 | 0.000 | 0.000 | 0.170 | 0.000 | ||
| 1 spectrum, ILHGLGFTPAMQR | 0.000 | 0.000 | 0.000 | 0.758 | 0.000 | 0.000 | 0.242 | 0.000 | ||
| 2 spectra, WPGDILAYK | 0.000 | 0.000 | 0.000 | 0.637 | 0.011 | 0.000 | 0.259 | 0.093 | ||
| 2 spectra, LIQQVAQEIWVCEK | 0.028 | 0.000 | 0.000 | 0.489 | 0.000 | 0.000 | 0.317 | 0.166 | ||
| 4 spectra, MMASGLTER | 0.000 | 0.000 | 0.000 | 0.489 | 0.287 | 0.000 | 0.224 | 0.000 | ||
| 1 spectrum, LLTGELLPTDGMIR | 0.000 | 0.000 | 0.000 | 0.813 | 0.000 | 0.000 | 0.106 | 0.081 | ||
| 3 spectra, FHWEQDQIAHMK | 0.070 | 0.000 | 0.041 | 0.799 | 0.000 | 0.000 | 0.072 | 0.018 | ||
| 4 spectra, LVDEEPQLTK | 0.000 | 0.000 | 0.000 | 0.434 | 0.151 | 0.000 | 0.379 | 0.036 | ||
| 3 spectra, DFSGGWR | 0.000 | 0.000 | 0.214 | 0.617 | 0.167 | 0.000 | 0.002 | 0.000 |
| Plot | Mito | Lyso or Perox | ER | Golgi | PM | Cytosol | Nucleus | ||||||
| Expt B |
2 peptides |
3 spectra |
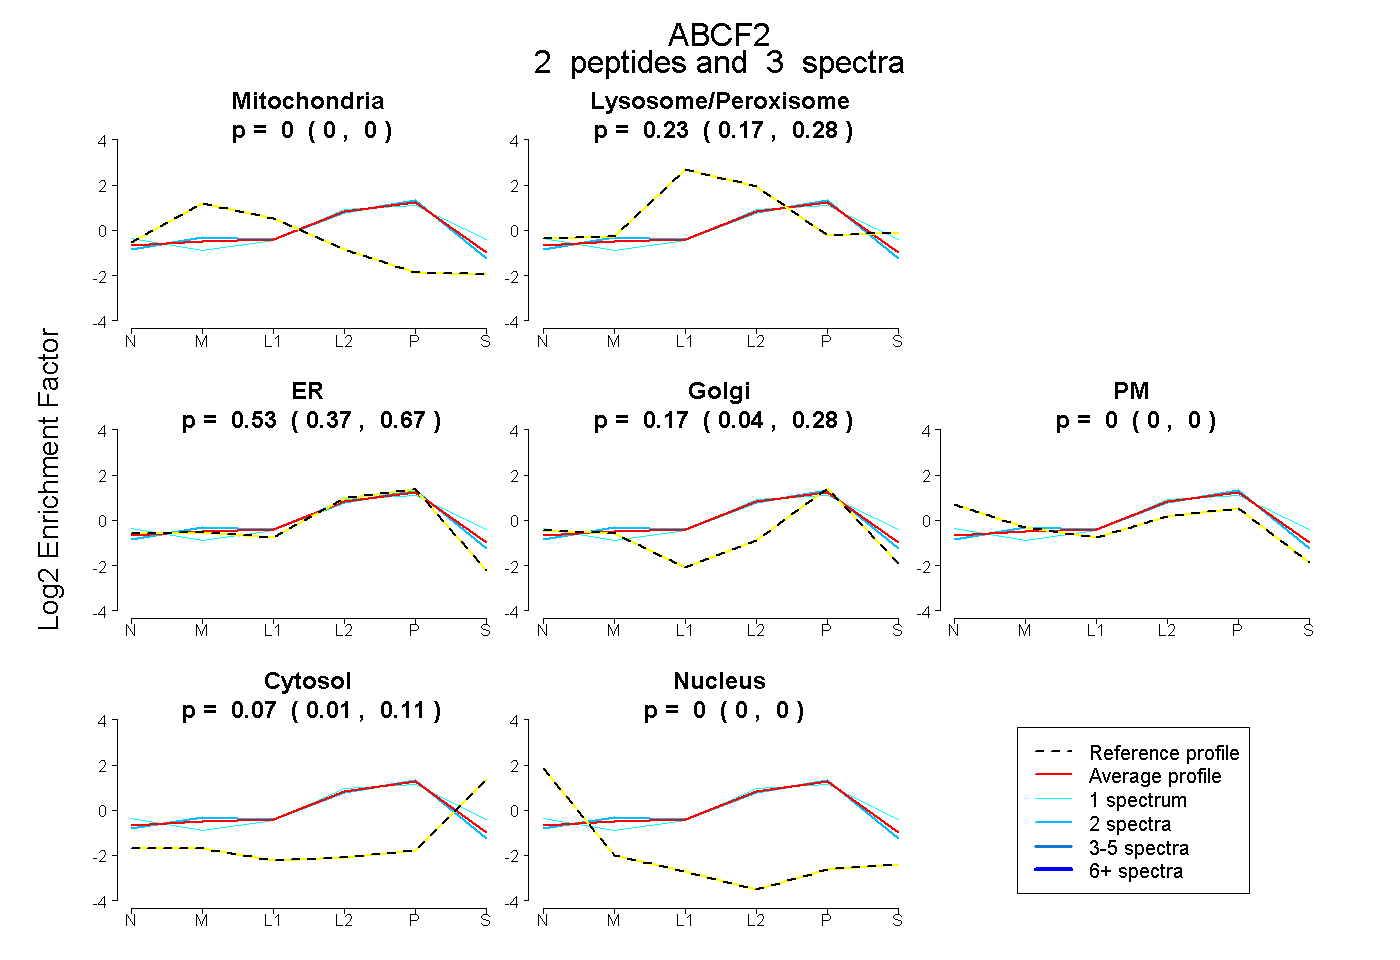 |
0.000 0.000 | 0.000 |
0.228 0.166 | 0.282 |
0.532 0.369 | 0.669 |
0.175 0.043 | 0.279 |
0.000 0.000 | 0.000 |
0.065 0.013 | 0.109 |
0.000 0.000 | 0.000 |
|||
| Plot | Lyso | Other | |||||||||||
| Expt C |
4 peptides |
8 spectra |
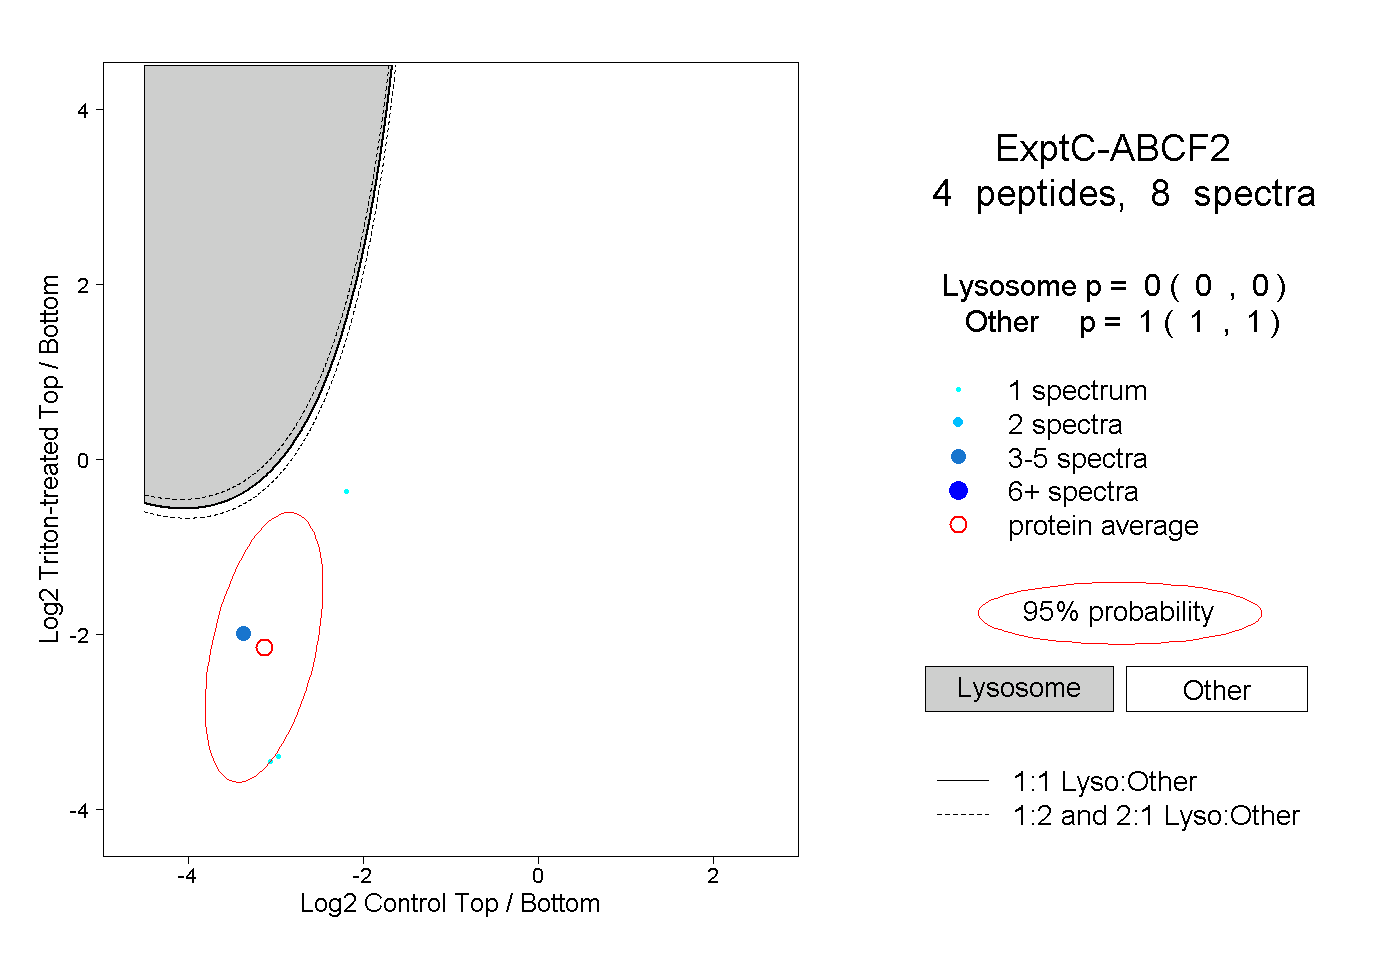 |
0.000 0.000 | 0.000 |
1.000 1.000 | 1.000 |
||||||||
| Plot | Lyso | Other | |||||||||||
| Expt D |
1 peptide |
1 spectrum |
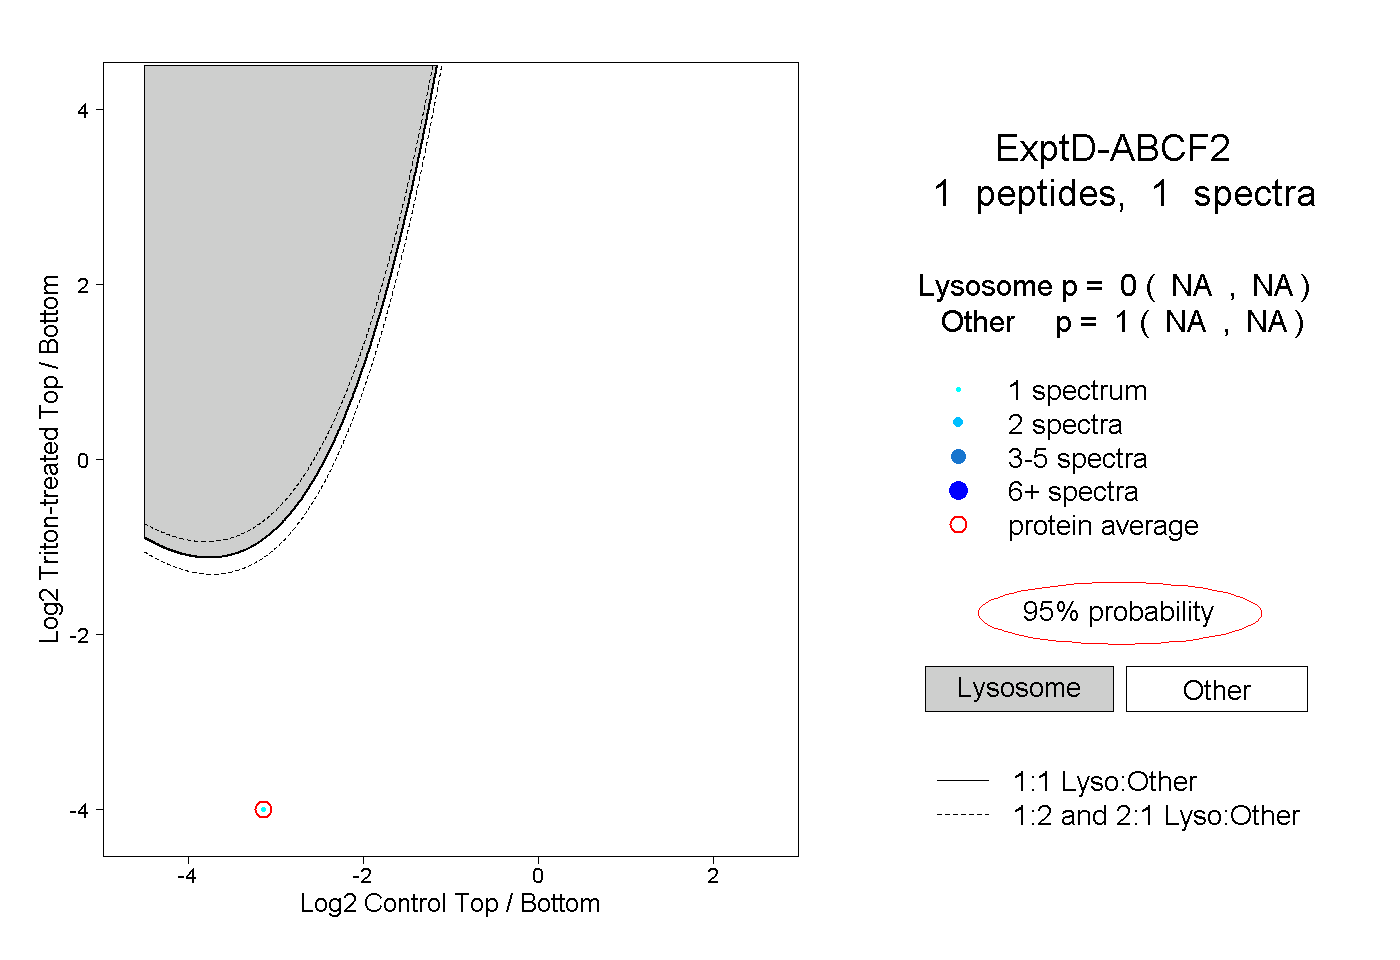 |
0.000 NA | NA |
1.000 NA | NA |