 8
8peptides
spectra
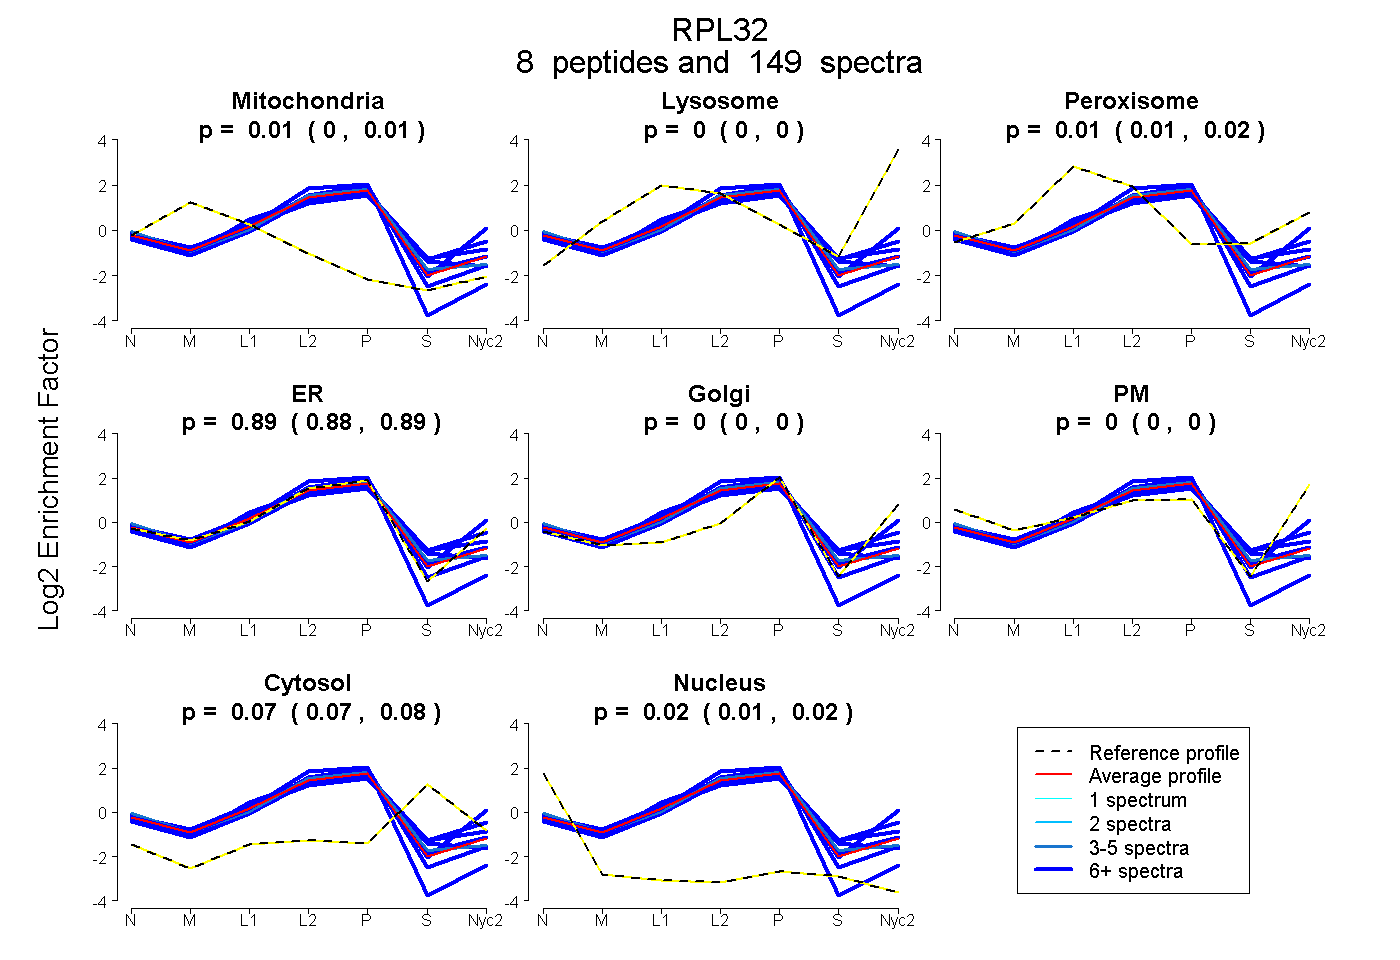
0.003 | 0.012
0.000 | 0.000
0.009 | 0.019
0.882 | 0.892
0.000 | 0.000
0.000 | 0.000
0.065 | 0.080
0.013 | 0.020
6peptides
spectra

0.000 | 0.000
0.227 | 0.256
0.707 | 0.767
0.000 | 0.029
0.000 | 0.015
0.000 | 0.000
0.000 | 0.000
9peptides
spectra

0.000 | 0.000
1.000 | 1.000
5peptides
spectra
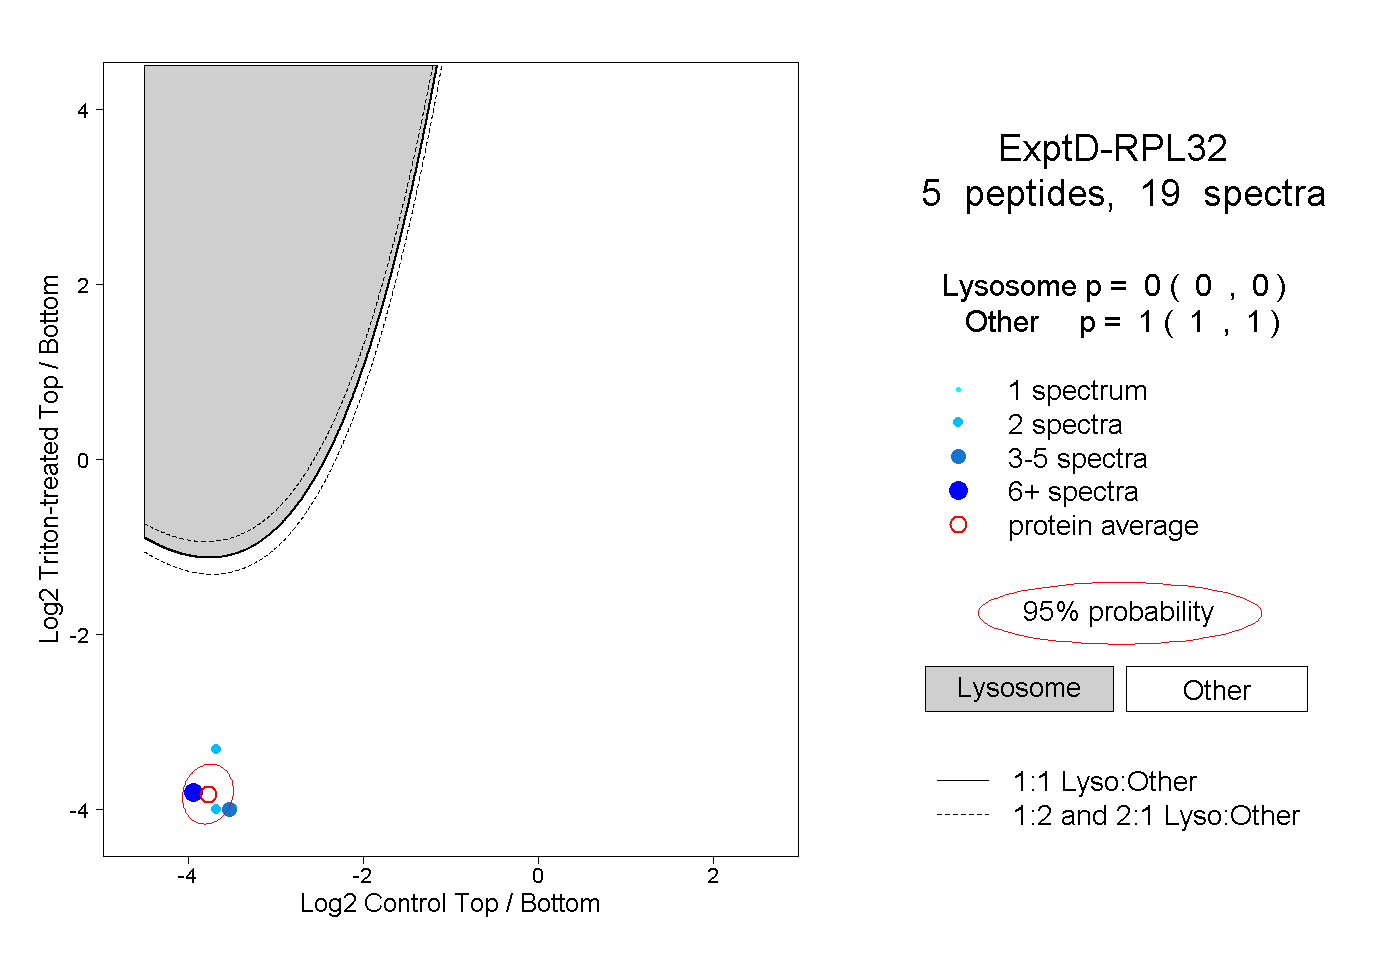
0.000 | 0.000
1.000 | 1.000