 8
8peptides
spectra
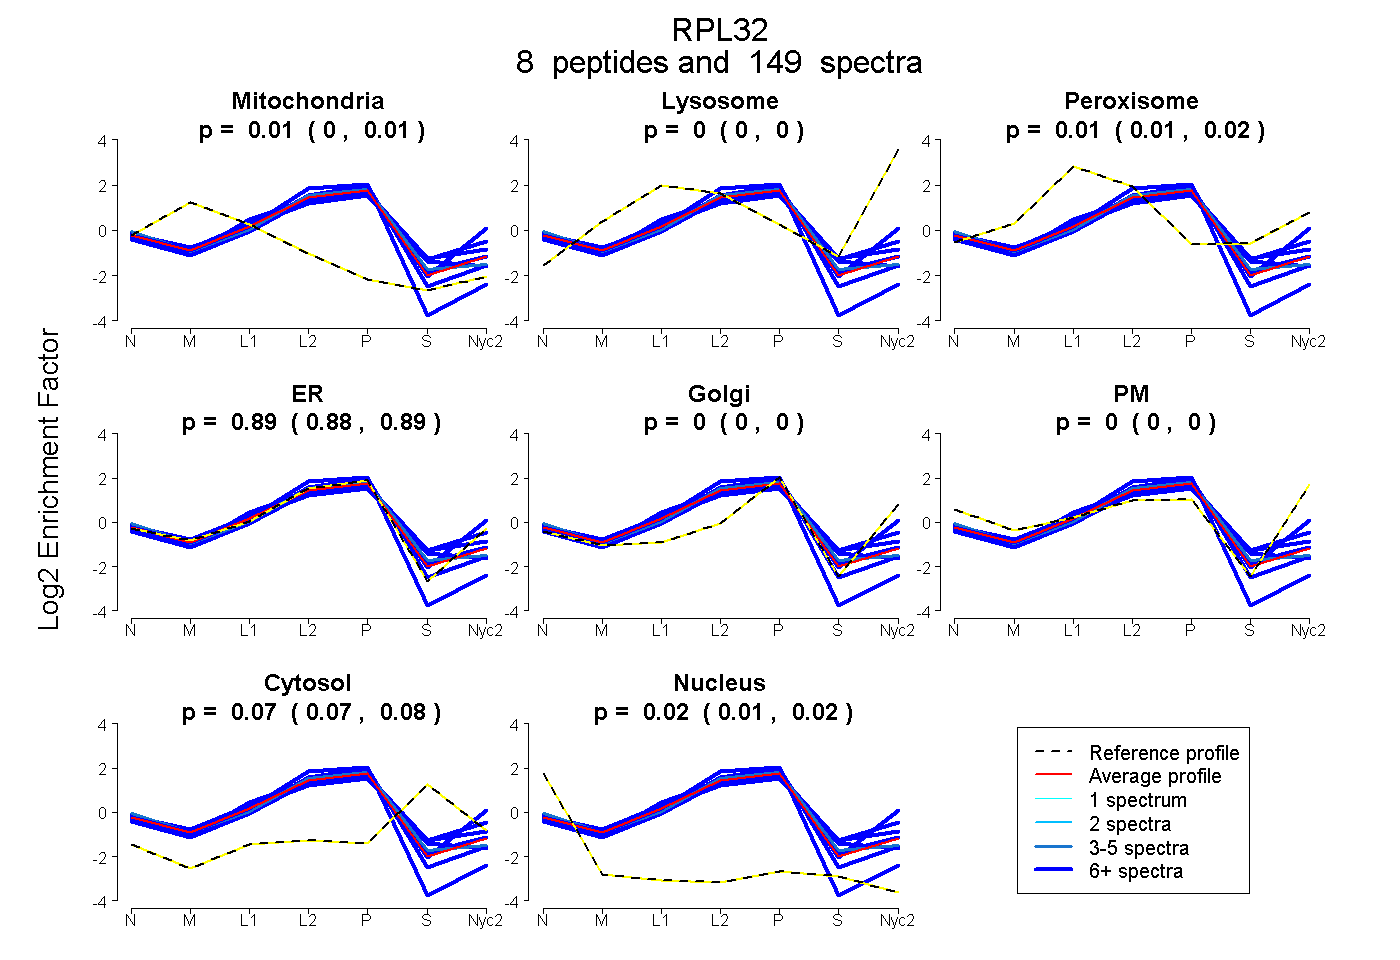
0.003 | 0.012
0.000 | 0.000
0.009 | 0.019
0.882 | 0.892
0.000 | 0.000
0.000 | 0.000
0.065 | 0.080
0.013 | 0.020
| Plot | Mito | Lyso | Perox | ER | Golgi | PM | Cytosol | Nucleus | |||||
| Expt A |
8 peptides |
149 spectra |
|
0.008 0.003 | 0.012 |
0.000 0.000 | 0.000 |
0.014 0.009 | 0.019 |
0.888 0.882 | 0.892 |
0.000 0.000 | 0.000 |
0.000 0.000 | 0.000 |
0.073 0.065 | 0.080 |
0.017 0.013 | 0.020 |
| 7 spectra, AALRPLVKPK | 0.000 | 0.000 | 0.000 | 0.935 | 0.000 | 0.000 | 0.000 | 0.065 | ||
| 15 spectra, AAQLAIR | 0.000 | 0.000 | 0.021 | 0.789 | 0.000 | 0.000 | 0.189 | 0.000 | ||
| 4 spectra, SYCAEIAHNVSSK | 0.000 | 0.000 | 0.001 | 0.878 | 0.000 | 0.000 | 0.092 | 0.028 | ||
| 8 spectra, ELEVLLMCNK | 0.016 | 0.000 | 0.046 | 0.763 | 0.000 | 0.000 | 0.145 | 0.030 | ||
| 9 spectra, GQILMPNIGYGSNK | 0.000 | 0.000 | 0.128 | 0.717 | 0.147 | 0.000 | 0.008 | 0.000 | ||
| 52 spectra, HMLPSGFR | 0.000 | 0.000 | 0.132 | 0.734 | 0.000 | 0.000 | 0.134 | 0.000 | ||
| 21 spectra, VTNPNAR | 0.000 | 0.000 | 0.000 | 0.926 | 0.000 | 0.000 | 0.000 | 0.074 | ||
| 33 spectra, FLVHNVK | 0.035 | 0.000 | 0.007 | 0.858 | 0.000 | 0.000 | 0.099 | 0.000 |
| Plot | Mito | Lyso or Perox | ER | Golgi | PM | Cytosol | Nucleus | ||||||
| Expt B |
6 peptides |
39 spectra |
 |
0.000 0.000 | 0.000 |
0.240 0.227 | 0.256 |
0.753 0.707 | 0.767 |
0.003 0.000 | 0.029 |
0.003 0.000 | 0.015 |
0.000 0.000 | 0.000 |
0.000 0.000 | 0.000 |
|||
| Plot | Lyso | Other | |||||||||||
| Expt C |
9 peptides |
126 spectra |
 |
0.000 0.000 | 0.000 |
1.000 1.000 | 1.000 |
||||||||
| Plot | Lyso | Other | |||||||||||
| Expt D |
5 peptides |
19 spectra |
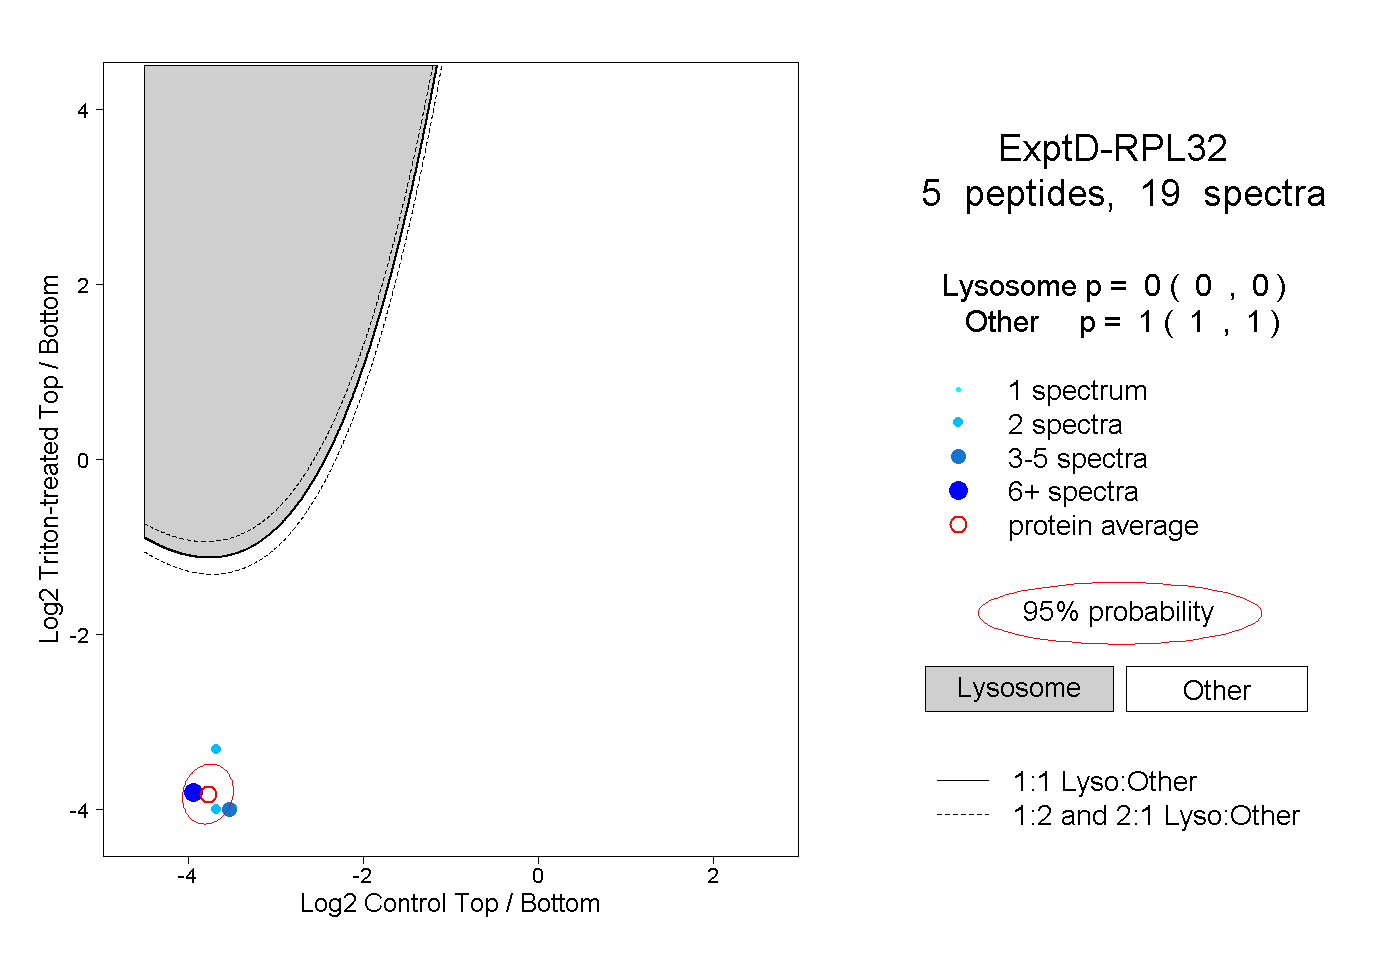 |
0.000 0.000 | 0.000 |
1.000 1.000 | 1.000 |