 7
7peptides
spectra
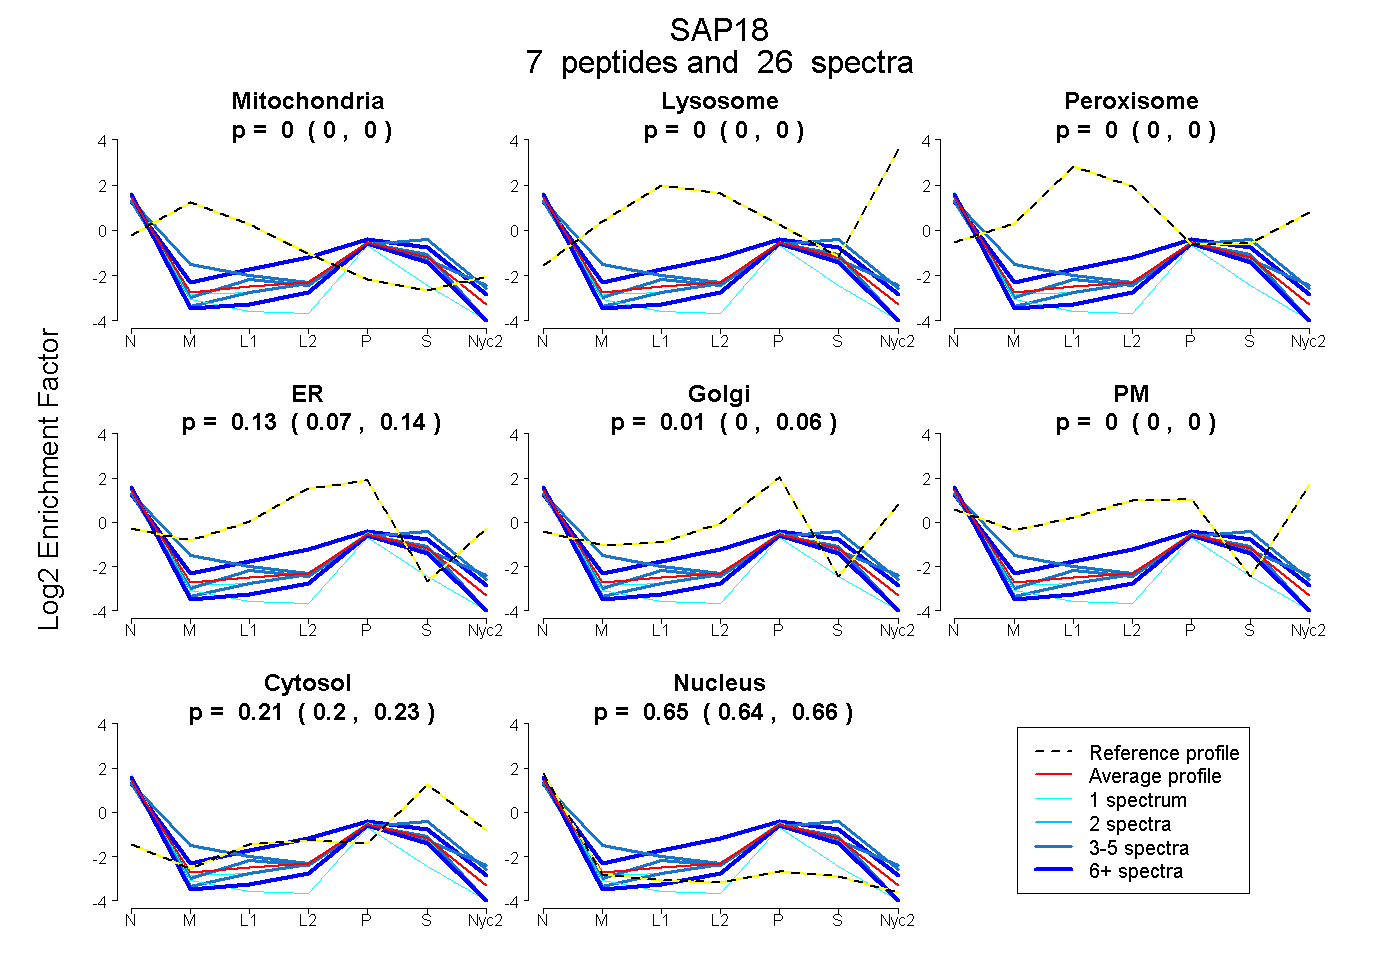
0.000 | 0.000
0.000 | 0.000
0.000 | 0.000
0.075 | 0.145
0.000 | 0.056
0.000 | 0.000
0.198 | 0.226
0.635 | 0.660
2peptides
spectra
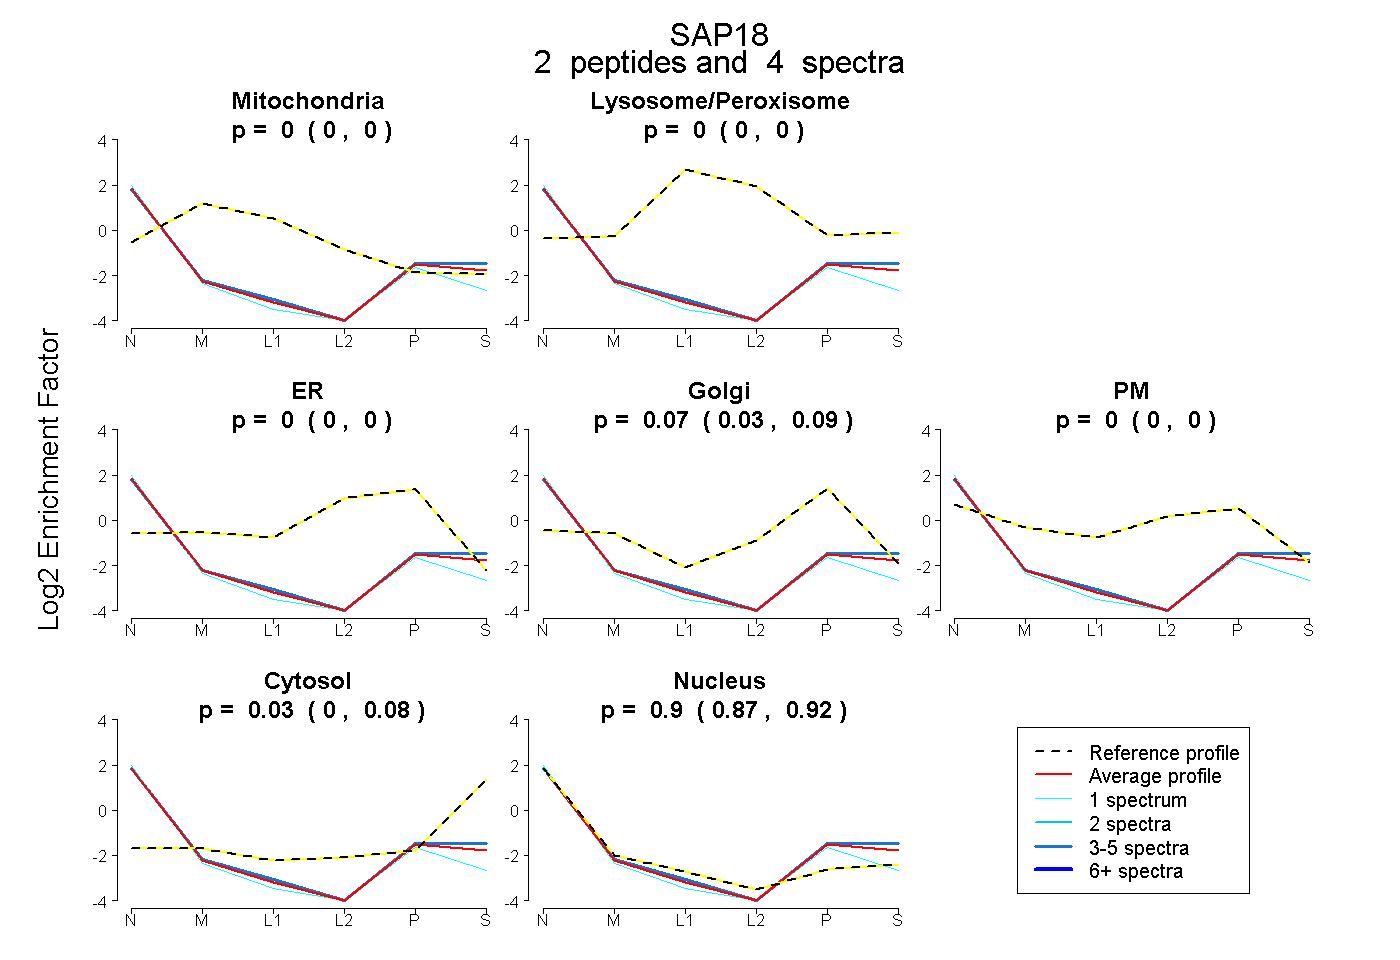
0.000 | 0.000
0.000 | 0.000
0.000 | 0.000
0.035 | 0.087
0.000 | 0.000
0.000 | 0.081
0.869 | 0.924