 7
7peptides
spectra
0.000 | 0.000
0.000 | 0.000
0.000 | 0.000
0.075 | 0.145
0.000 | 0.056
0.000 | 0.000
0.198 | 0.226
0.635 | 0.660
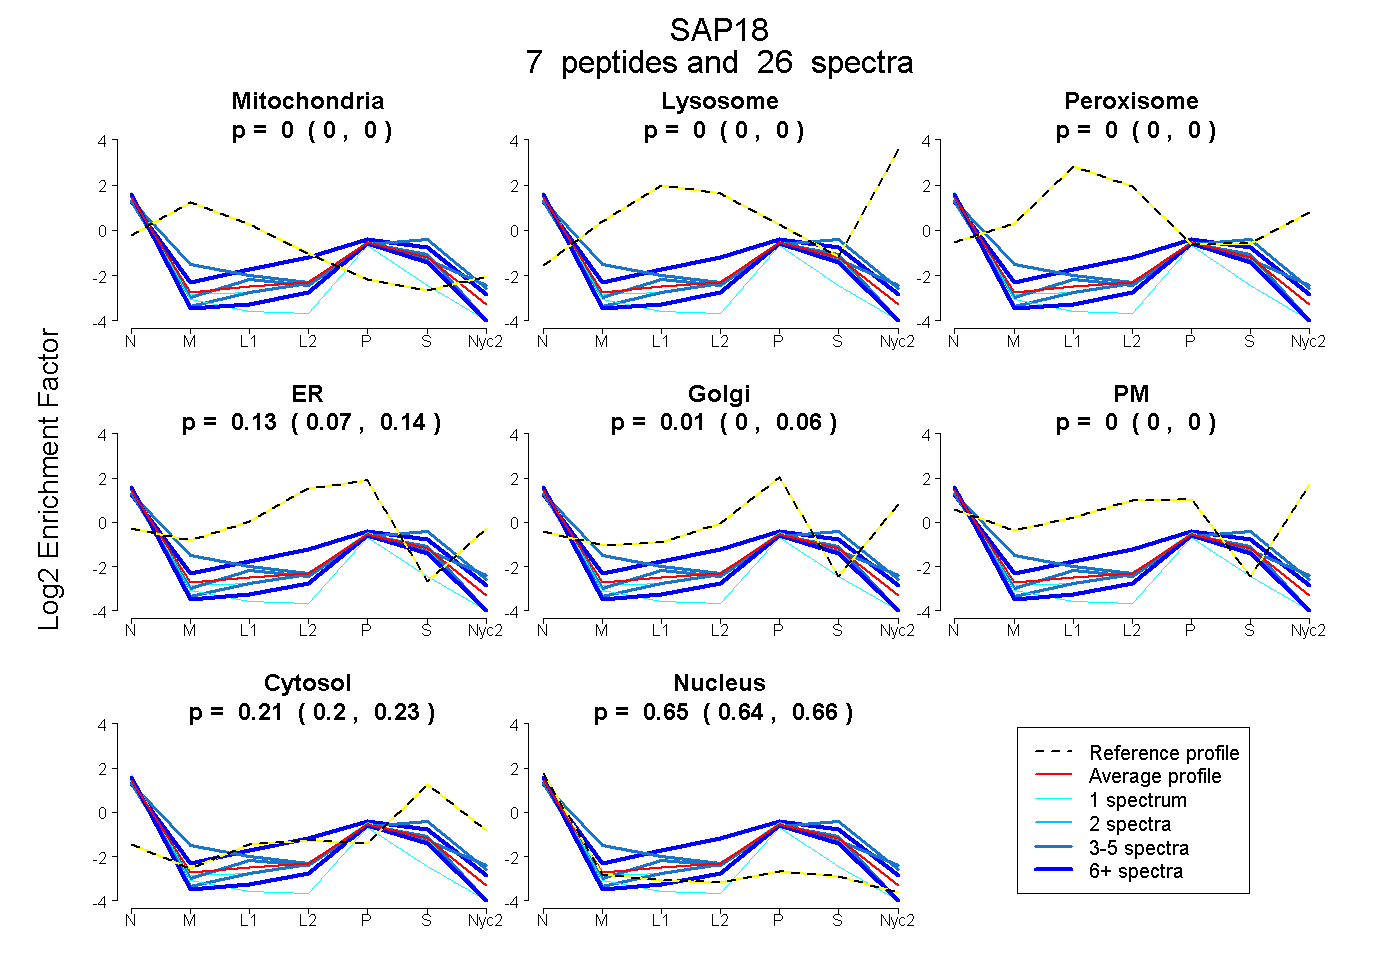
| Plot | Mito | Lyso | Perox | ER | Golgi | PM | Cytosol | Nucleus | |||||
| Expt A |
7 peptides |
26 spectra |
|
0.000 0.000 | 0.000 |
0.000 0.000 | 0.000 |
0.000 0.000 | 0.000 |
0.126 0.075 | 0.145 |
0.010 0.000 | 0.056 |
0.000 0.000 | 0.000 |
0.214 0.198 | 0.226 |
0.649 0.635 | 0.660 |
| 6 spectra, VTQEEIK | 0.000 | 0.000 | 0.000 | 0.000 | 0.041 | 0.000 | 0.162 | 0.797 | ||
| 7 spectra, APPSSGR | 0.000 | 0.000 | 0.000 | 0.255 | 0.000 | 0.000 | 0.275 | 0.469 | ||
| 1 spectrum, VFTTNNGR | 0.000 | 0.000 | 0.000 | 0.000 | 0.074 | 0.000 | 0.000 | 0.926 | ||
| 3 spectra, EVYPEAR | 0.000 | 0.000 | 0.000 | 0.000 | 0.095 | 0.000 | 0.387 | 0.518 | ||
| 5 spectra, EIGSTMSGR | 0.069 | 0.000 | 0.000 | 0.000 | 0.235 | 0.000 | 0.173 | 0.524 | ||
| 3 spectra, EPEKPIDR | 0.000 | 0.000 | 0.000 | 0.066 | 0.000 | 0.000 | 0.218 | 0.716 | ||
| 1 spectrum, ELTSLVK | 0.000 | 0.000 | 0.000 | 0.115 | 0.000 | 0.000 | 0.170 | 0.715 |
| Plot | Mito | Lyso or Perox | ER | Golgi | PM | Cytosol | Nucleus | ||||||
| Expt B |
2 peptides |
4 spectra |
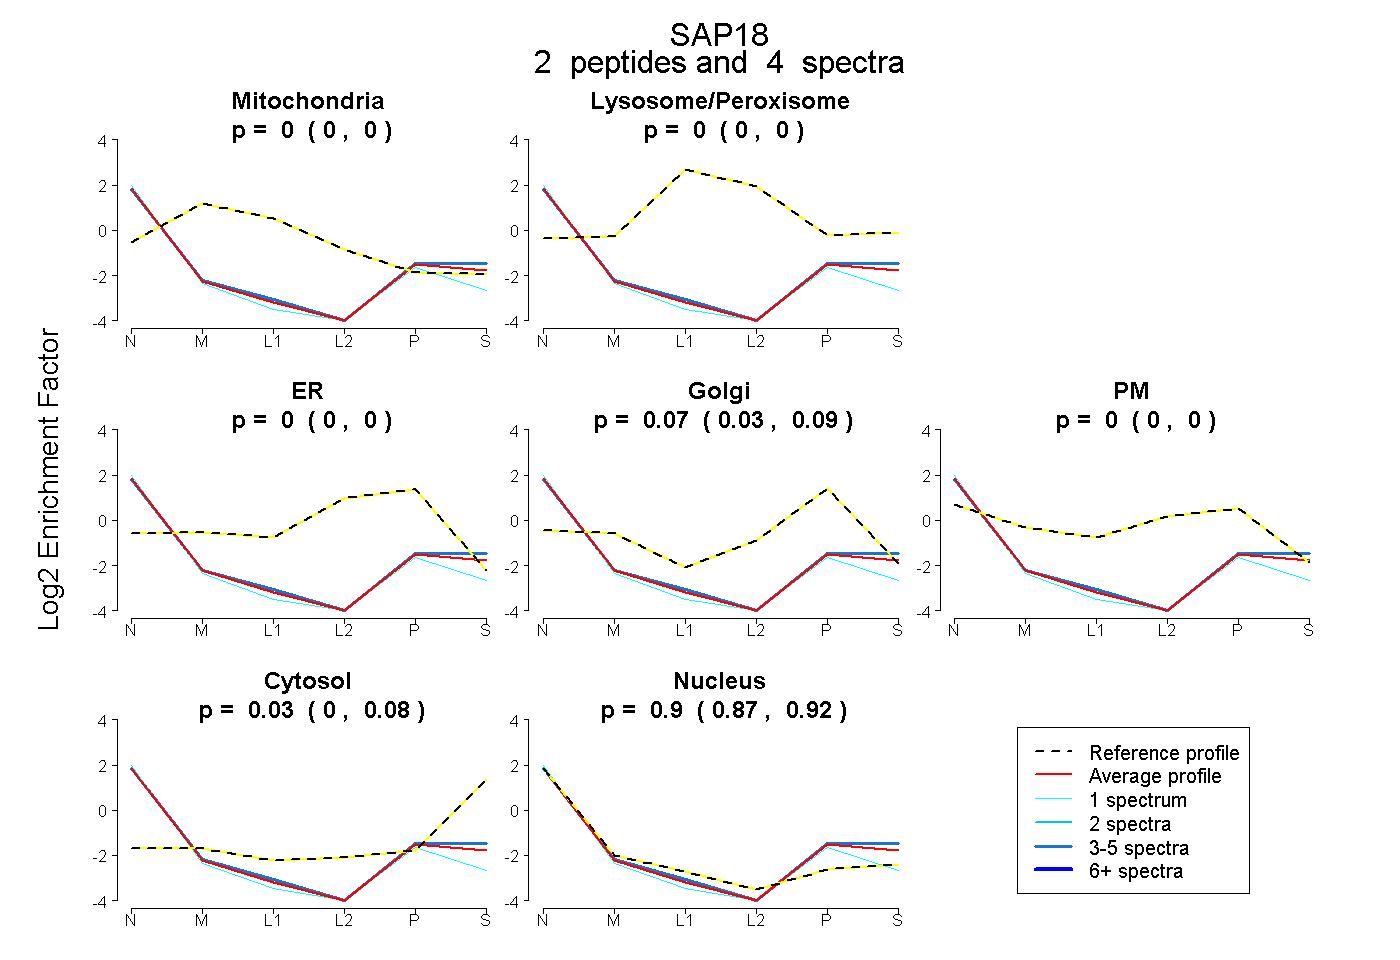 |
0.000 0.000 | 0.000 |
0.000 0.000 | 0.000 |
0.000 0.000 | 0.000 |
0.067 0.035 | 0.087 |
0.000 0.000 | 0.000 |
0.031 0.000 | 0.081 |
0.902 0.869 | 0.924 |