 9
9peptides
spectra
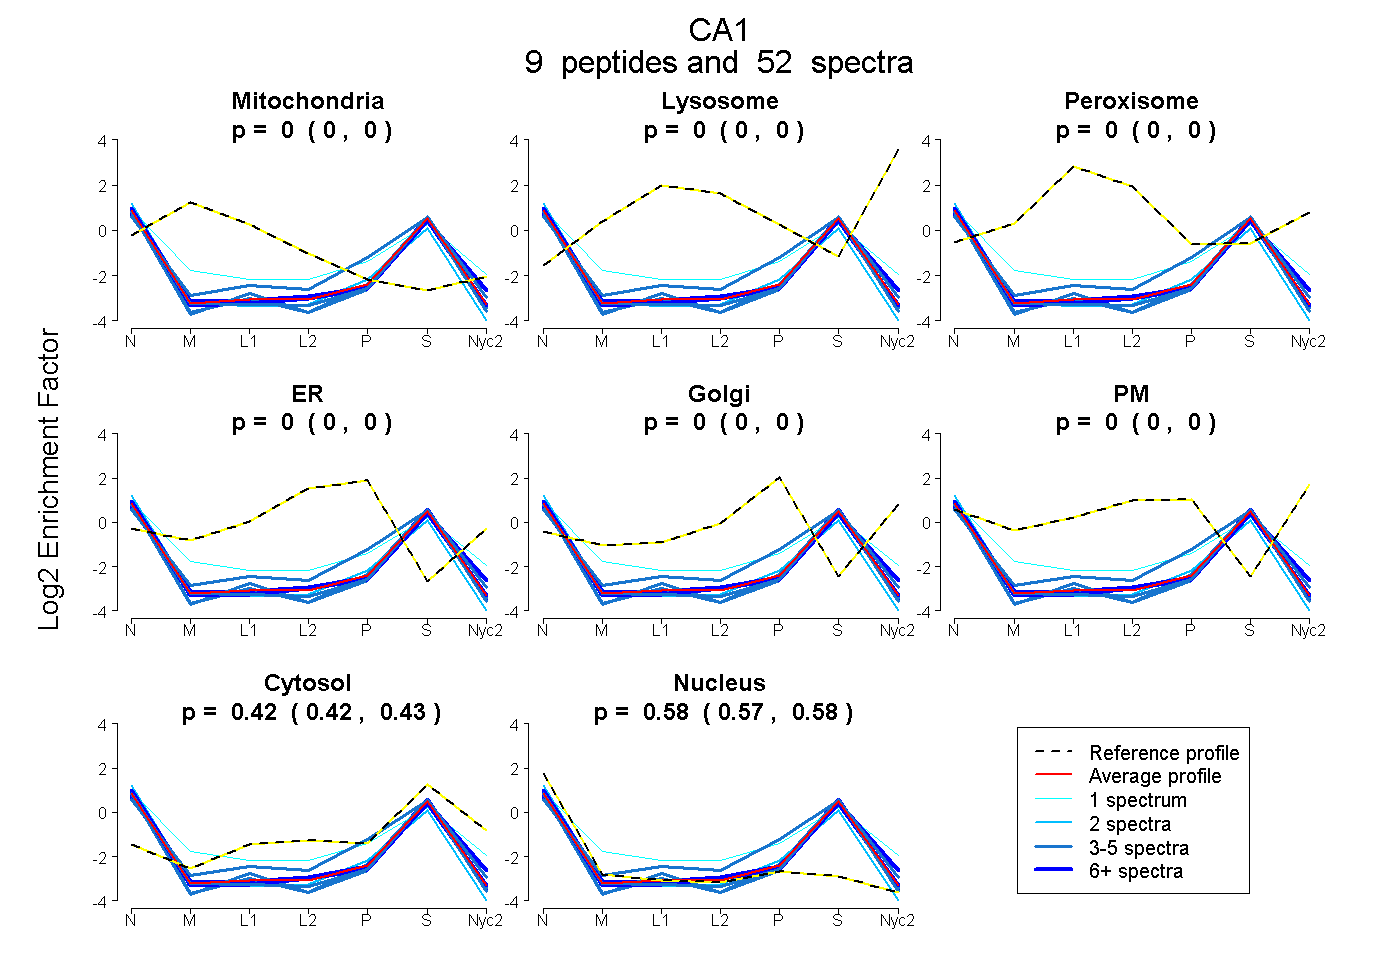
0.000 | 0.000
0.000 | 0.000
0.000 | 0.000
0.000 | 0.000
0.000 | 0.000
0.000 | 0.000
0.419 | 0.427
0.572 | 0.580
5peptides
spectra
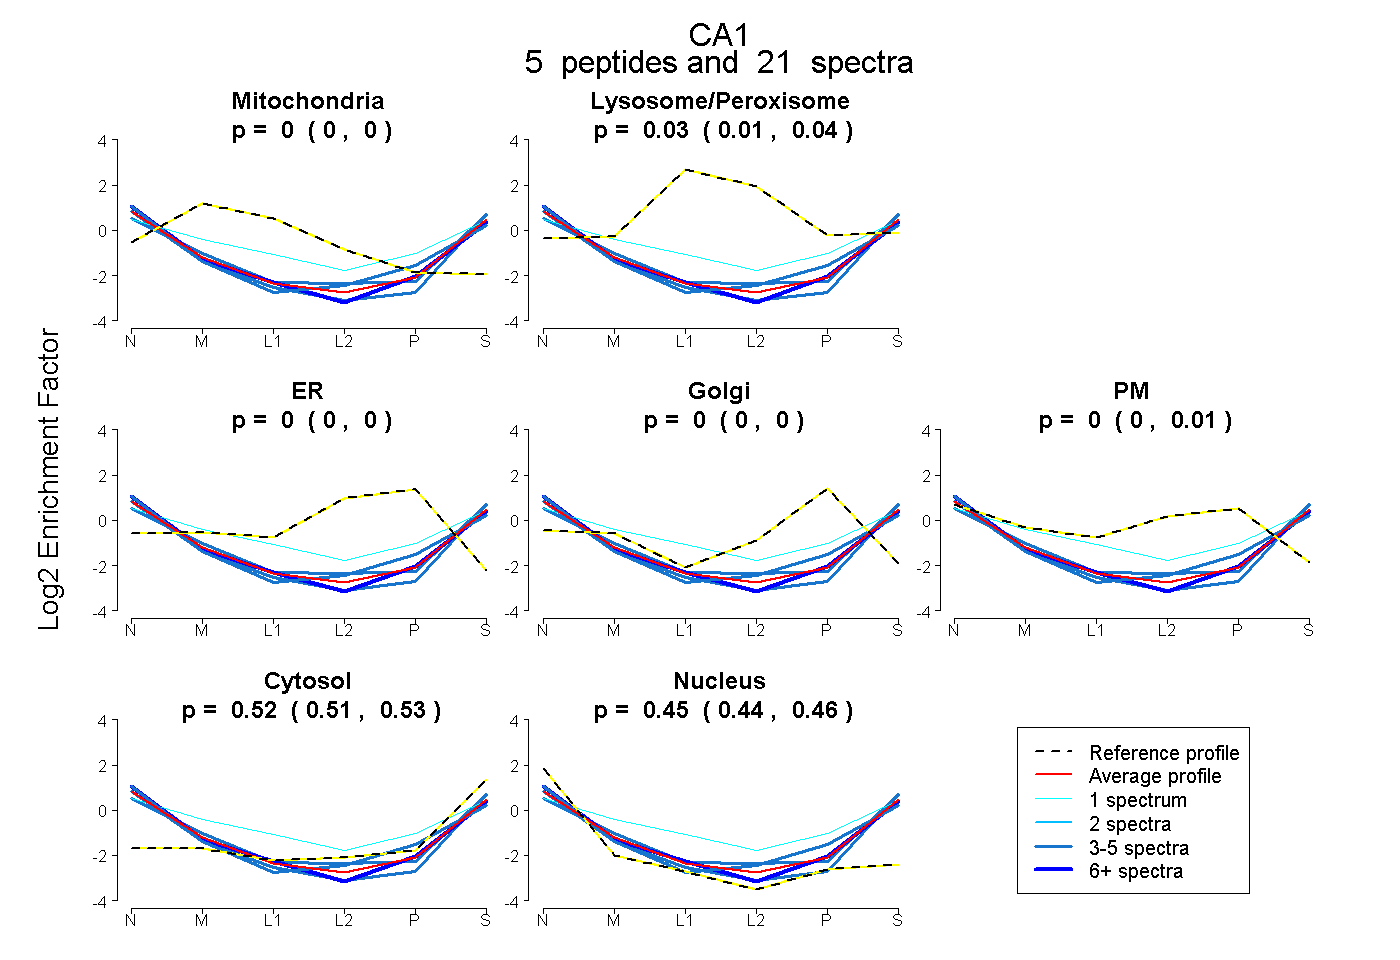
0.000 | 0.000
0.009 | 0.038
0.000 | 0.000
0.000 | 0.000
0.000 | 0.007
0.508 | 0.534
0.437 | 0.462
4peptides
spectra
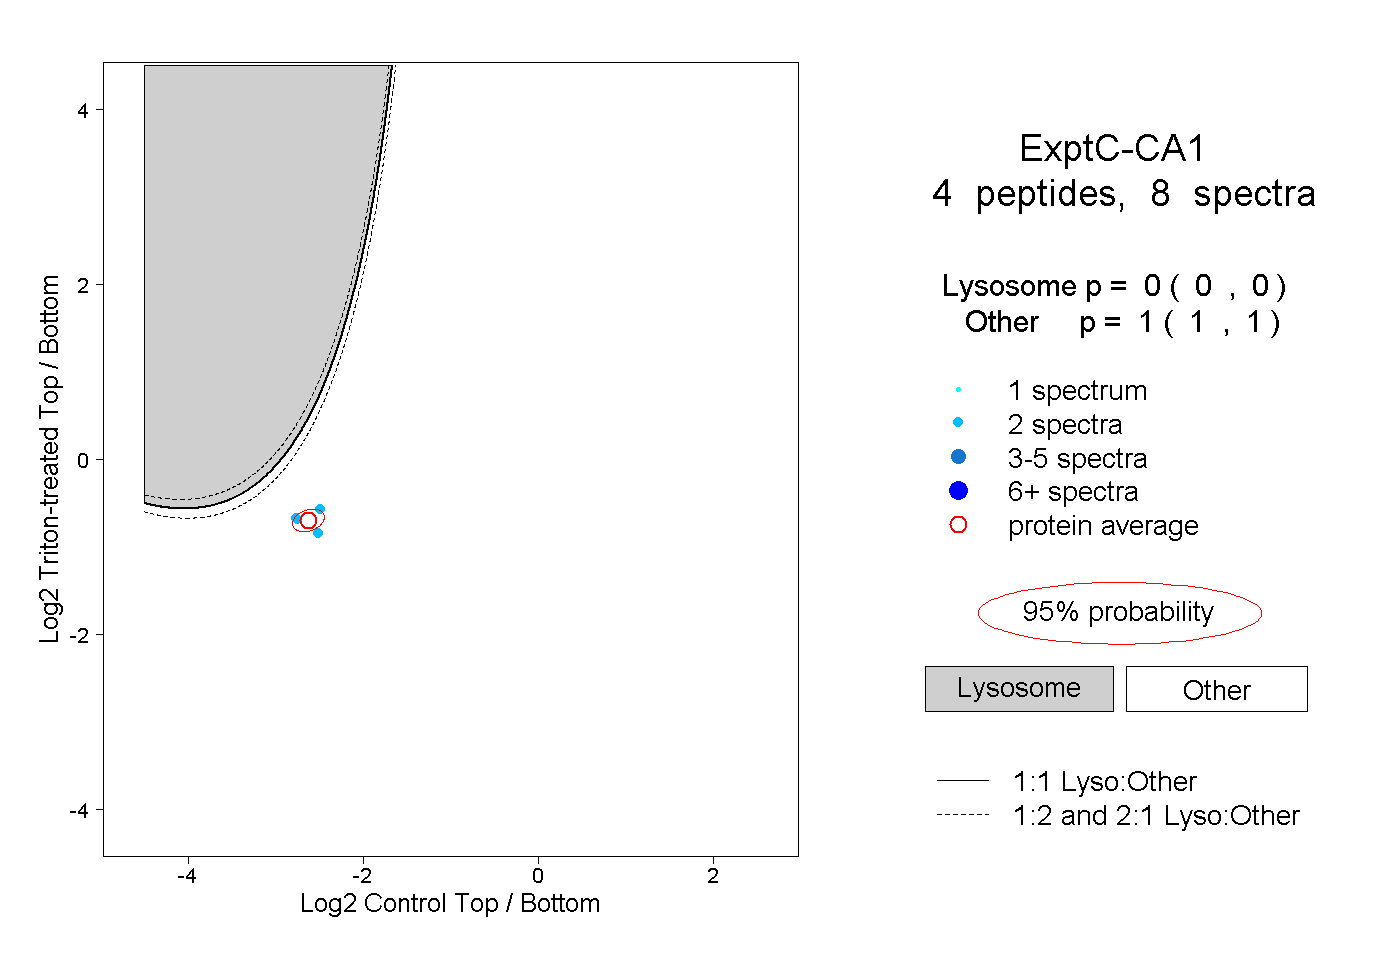
0.000 | 0.000
1.000 | 1.000
2peptides
spectra
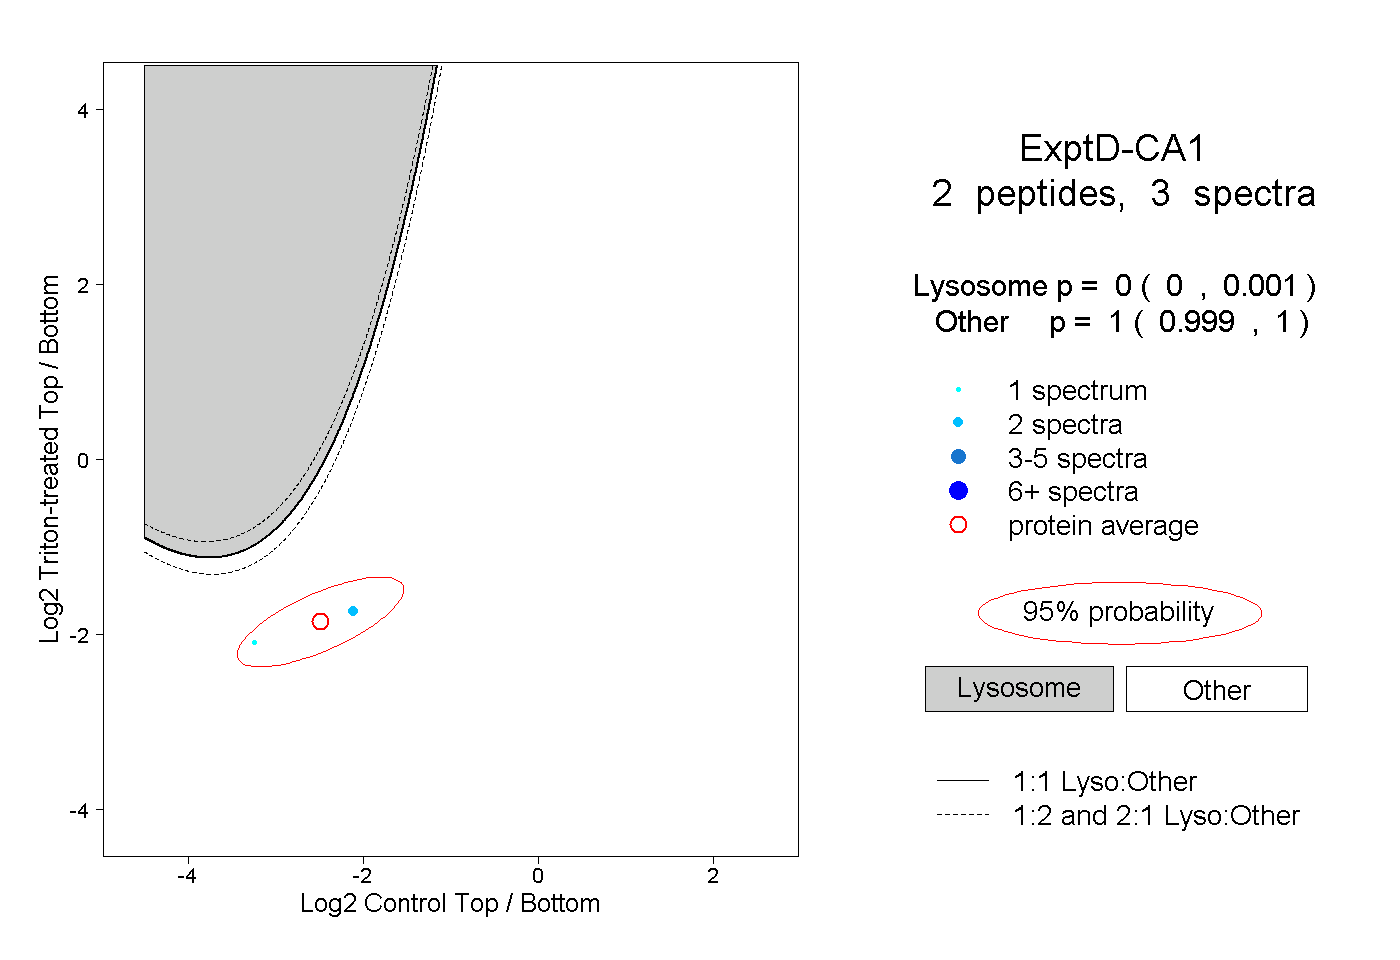
0.000 | 0.001
0.999 | 1.000