 9
9peptides
spectra
0.000 | 0.000
0.000 | 0.000
0.000 | 0.000
0.000 | 0.000
0.000 | 0.000
0.000 | 0.000
0.419 | 0.427
0.572 | 0.580
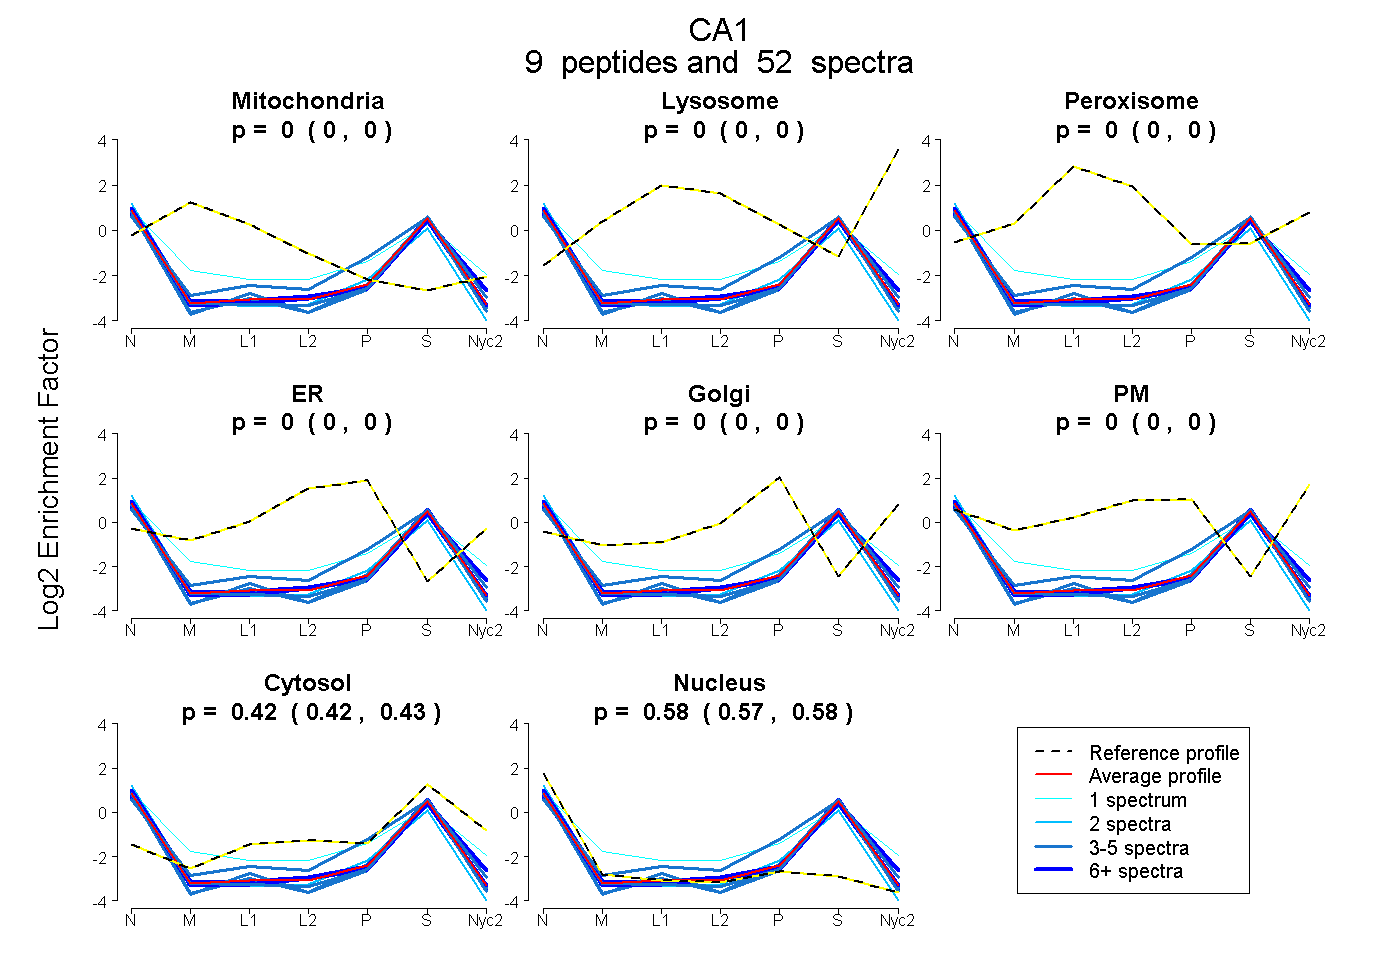
| Plot | Mito | Lyso | Perox | ER | Golgi | PM | Cytosol | Nucleus | |||||
| Expt A |
9 peptides |
52 spectra |
|
0.000 0.000 | 0.000 |
0.000 0.000 | 0.000 |
0.000 0.000 | 0.000 |
0.000 0.000 | 0.000 |
0.000 0.000 | 0.000 |
0.000 0.000 | 0.000 |
0.423 0.419 | 0.427 |
0.577 0.572 | 0.580 |
| 5 spectra, YSSAAEAISK | 0.000 | 0.000 | 0.000 | 0.000 | 0.000 | 0.000 | 0.391 | 0.609 | ||
| 8 spectra, VGPANPNLQK | 0.000 | 0.000 | 0.000 | 0.000 | 0.000 | 0.000 | 0.403 | 0.597 | ||
| 19 spectra, ADGLAIIGVLMK | 0.000 | 0.000 | 0.000 | 0.000 | 0.000 | 0.000 | 0.435 | 0.565 | ||
| 4 spectra, ESISLSPEQLAQLR | 0.000 | 0.000 | 0.000 | 0.000 | 0.000 | 0.000 | 0.402 | 0.598 | ||
| 2 spectra, NGPDQWSK | 0.000 | 0.000 | 0.000 | 0.000 | 0.000 | 0.000 | 0.303 | 0.697 | ||
| 4 spectra, GGPLADSYR | 0.000 | 0.000 | 0.000 | 0.000 | 0.000 | 0.000 | 0.398 | 0.602 | ||
| 6 spectra, VLDALSSVK | 0.000 | 0.000 | 0.000 | 0.000 | 0.000 | 0.000 | 0.443 | 0.557 | ||
| 3 spectra, YSGELHLVHWNSAK | 0.000 | 0.000 | 0.000 | 0.000 | 0.000 | 0.000 | 0.551 | 0.449 | ||
| 1 spectrum, LYPIANGNNQSPIDIK | 0.009 | 0.000 | 0.000 | 0.000 | 0.000 | 0.052 | 0.541 | 0.398 |
| Plot | Mito | Lyso or Perox | ER | Golgi | PM | Cytosol | Nucleus | ||||||
| Expt B |
5 peptides |
21 spectra |
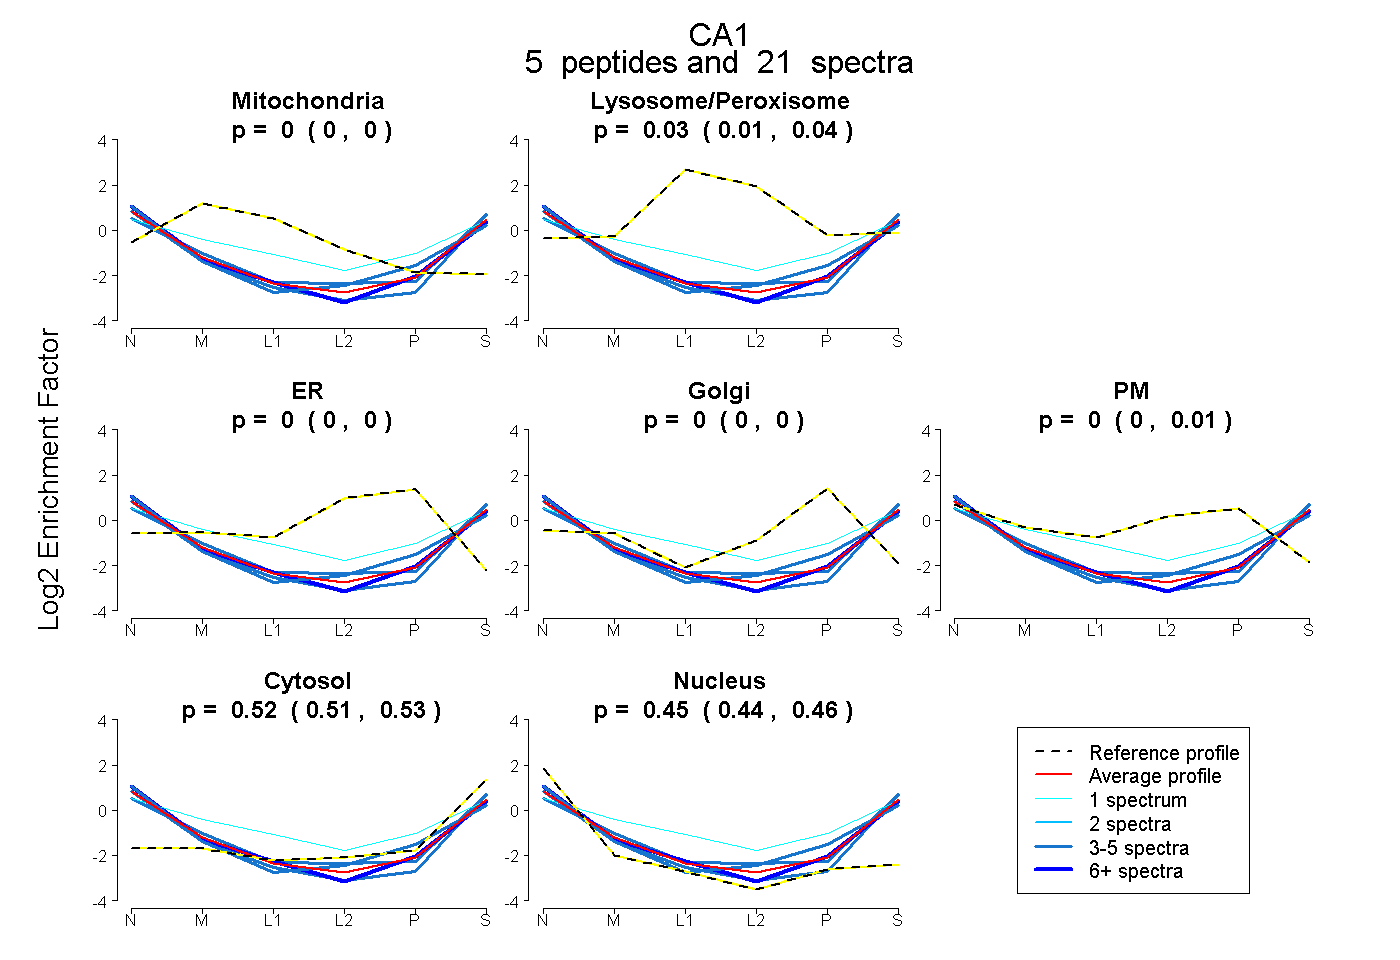 |
0.000 0.000 | 0.000 |
0.025 0.009 | 0.038 |
0.000 0.000 | 0.000 |
0.000 0.000 | 0.000 |
0.000 0.000 | 0.007 |
0.522 0.508 | 0.534 |
0.453 0.437 | 0.462 |
|||
| Plot | Lyso | Other | |||||||||||
| Expt C |
4 peptides |
8 spectra |
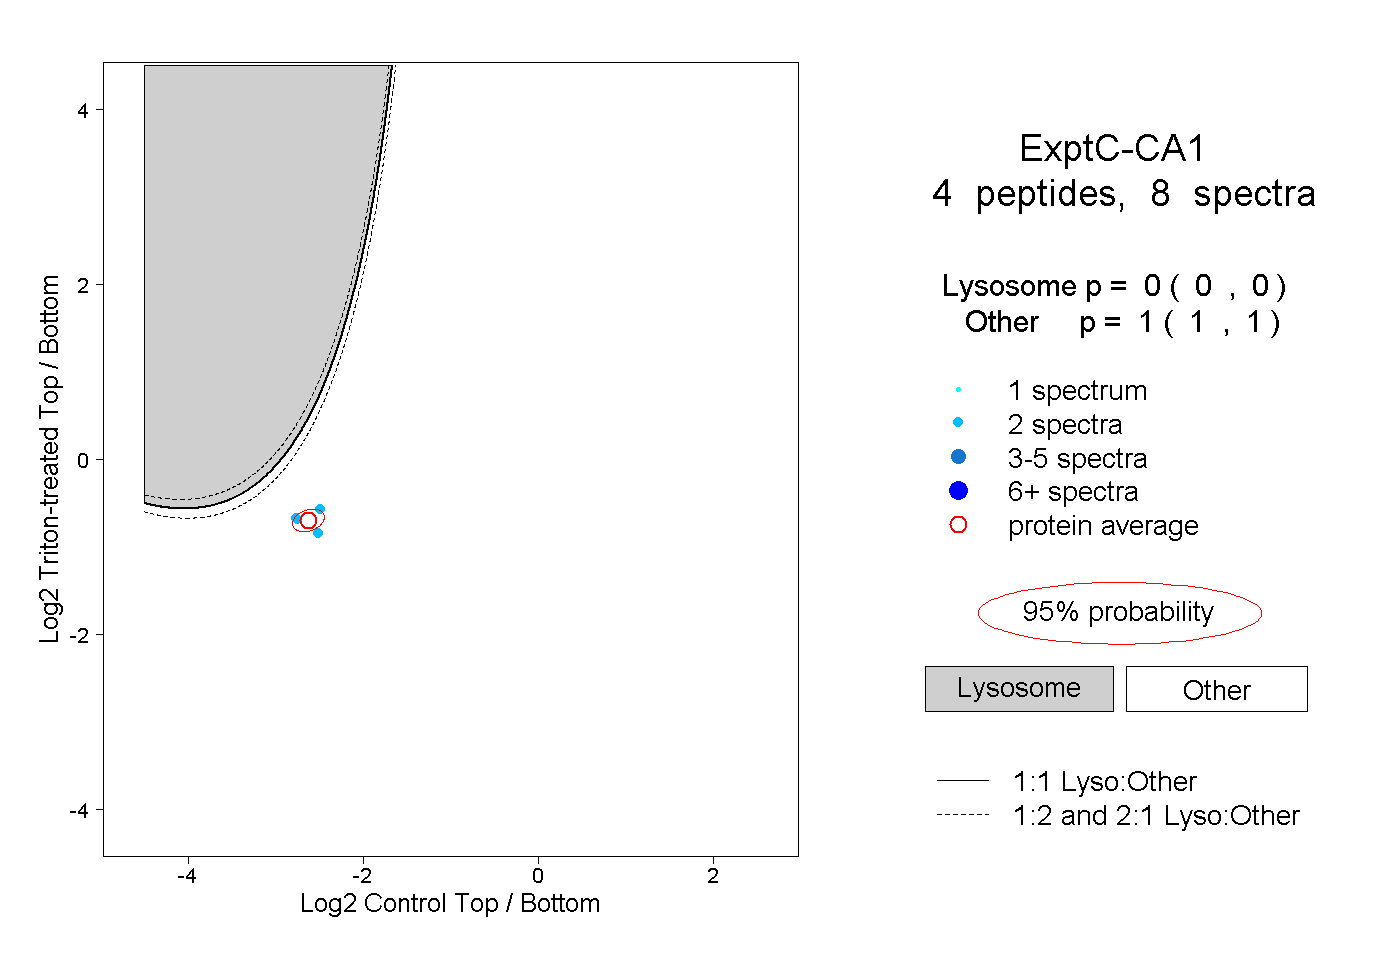 |
0.000 0.000 | 0.000 |
1.000 1.000 | 1.000 |
||||||||
| Plot | Lyso | Other | |||||||||||
| Expt D |
2 peptides |
3 spectra |
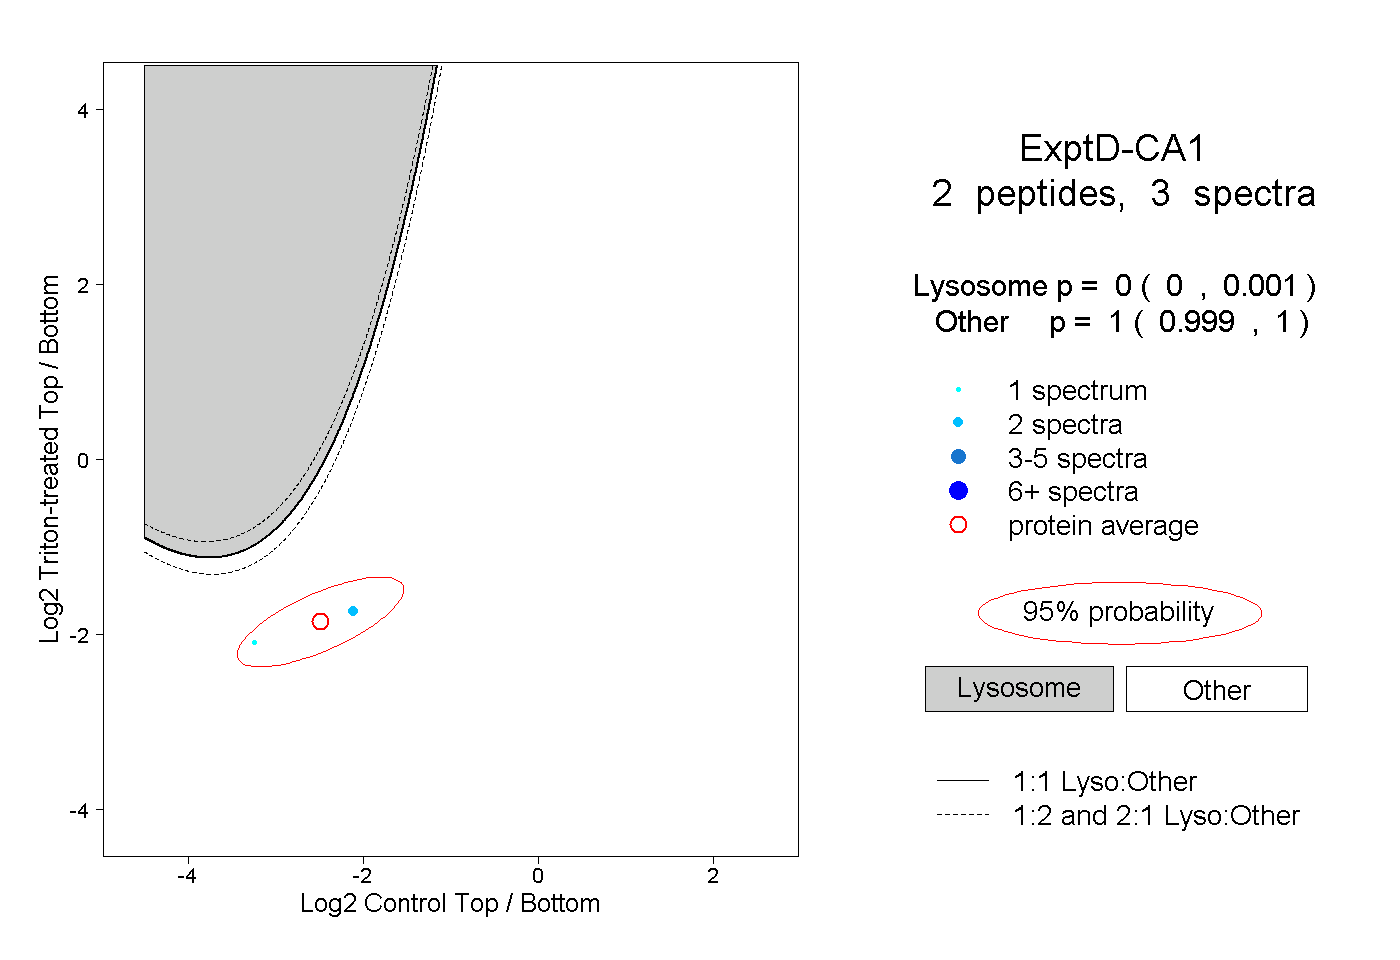 |
0.000 0.000 | 0.001 |
1.000 0.999 | 1.000 |