 7
7peptides
spectra
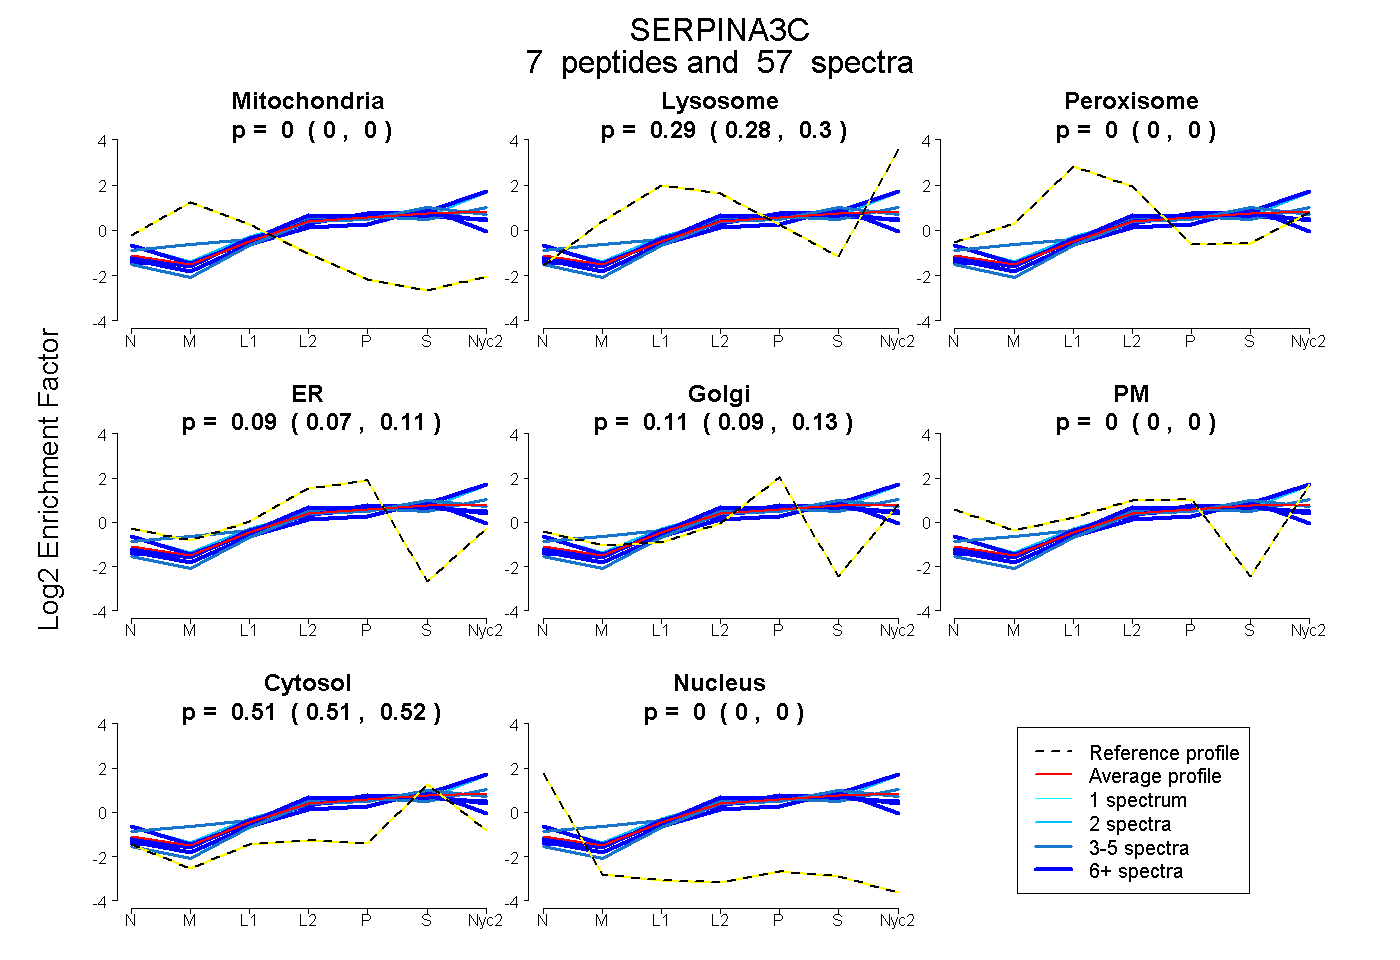
0.000 | 0.000
0.280 | 0.297
0.000 | 0.000
0.066 | 0.105
0.092 | 0.125
0.000 | 0.000
0.509 | 0.519
0.000 | 0.000
6peptides
spectra
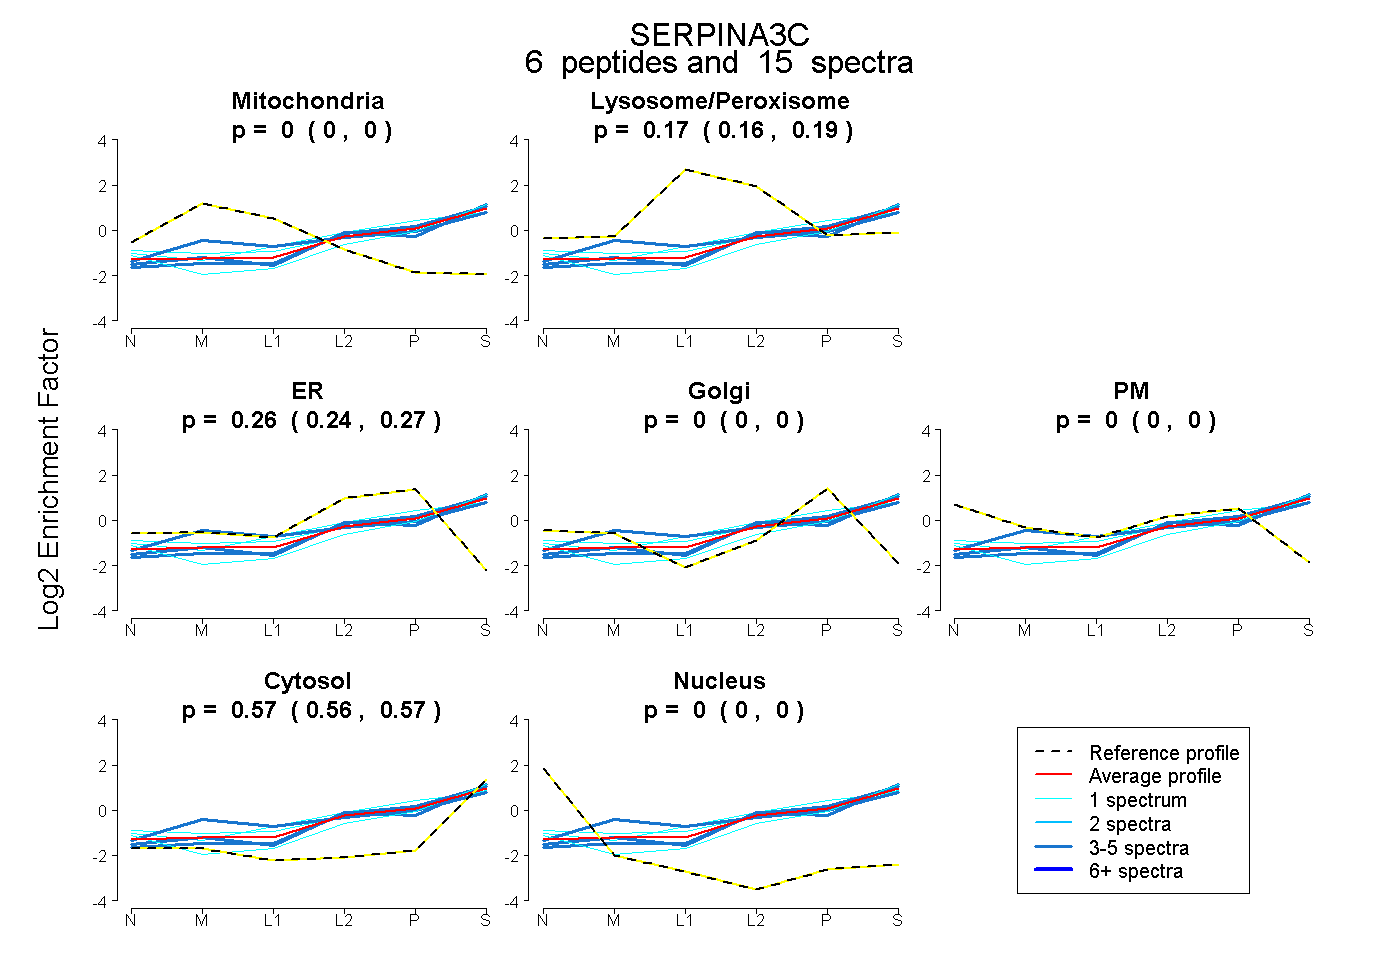
0.000 | 0.000
0.157 | 0.190
0.245 | 0.272
0.000 | 0.000
0.000 | 0.000
0.556 | 0.573
0.000 | 0.000
8peptides
spectra
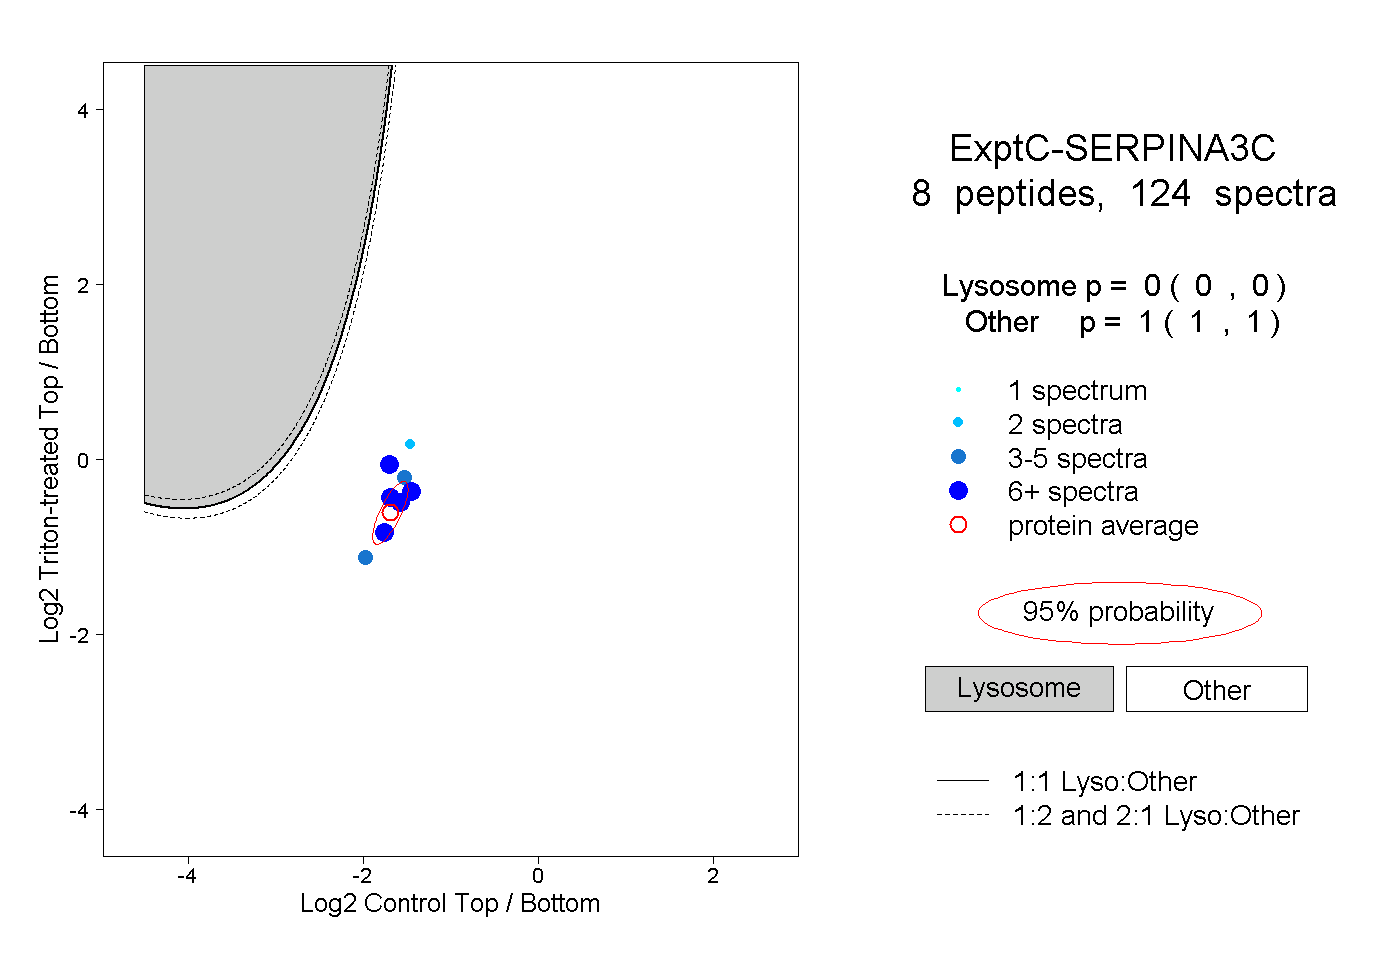
0.000 | 0.000
1.000 | 1.000
3peptides
spectra
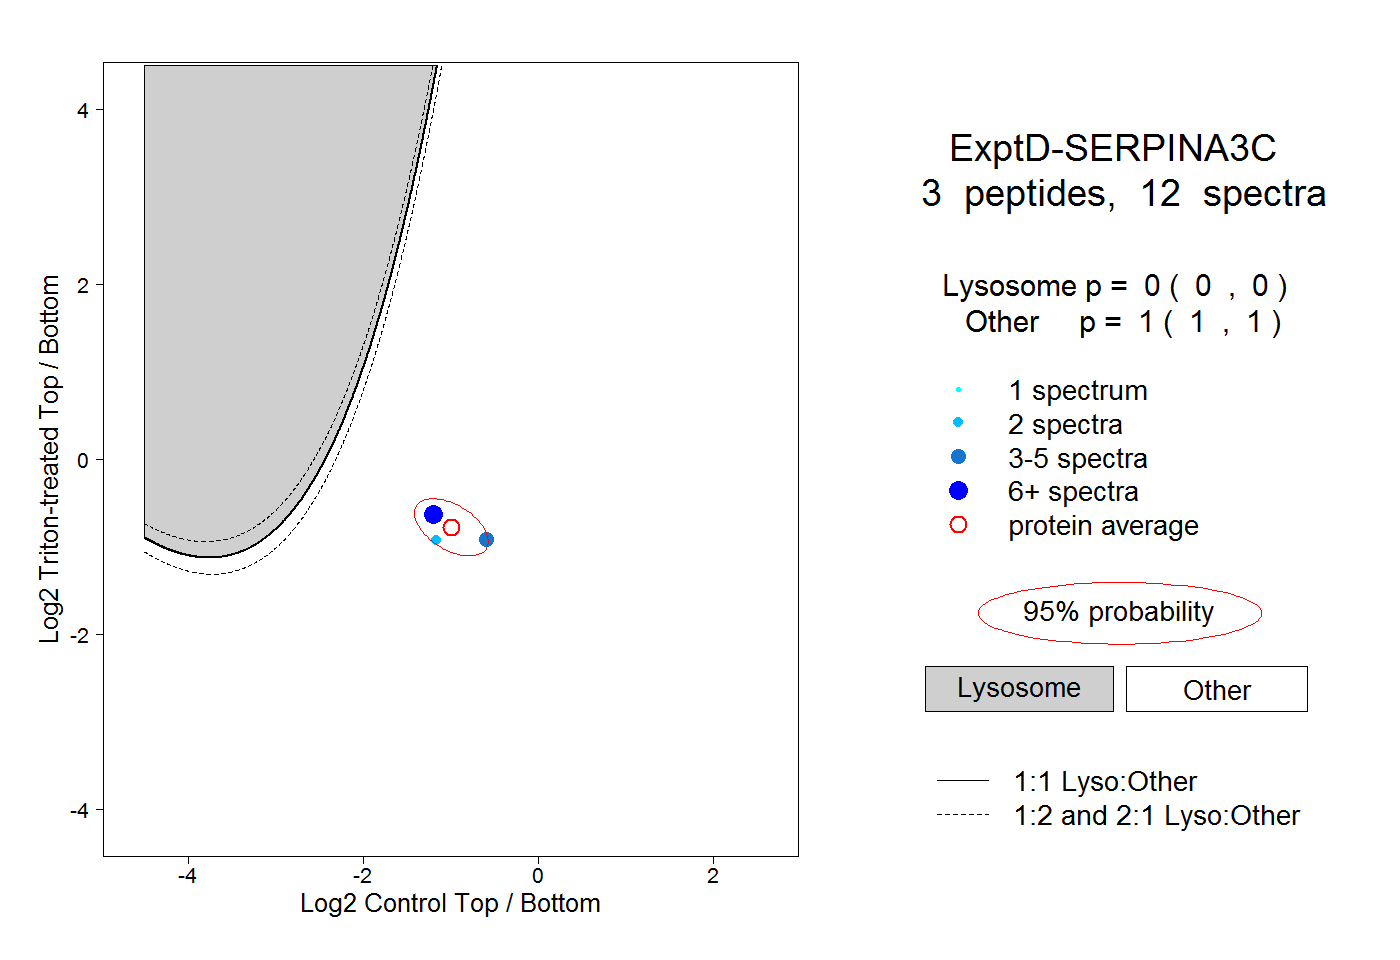
0.000 | 0.000
1.000 | 1.000