 7
7peptides
spectra
0.000 | 0.000
0.280 | 0.297
0.000 | 0.000
0.066 | 0.105
0.092 | 0.125
0.000 | 0.000
0.509 | 0.519
0.000 | 0.000
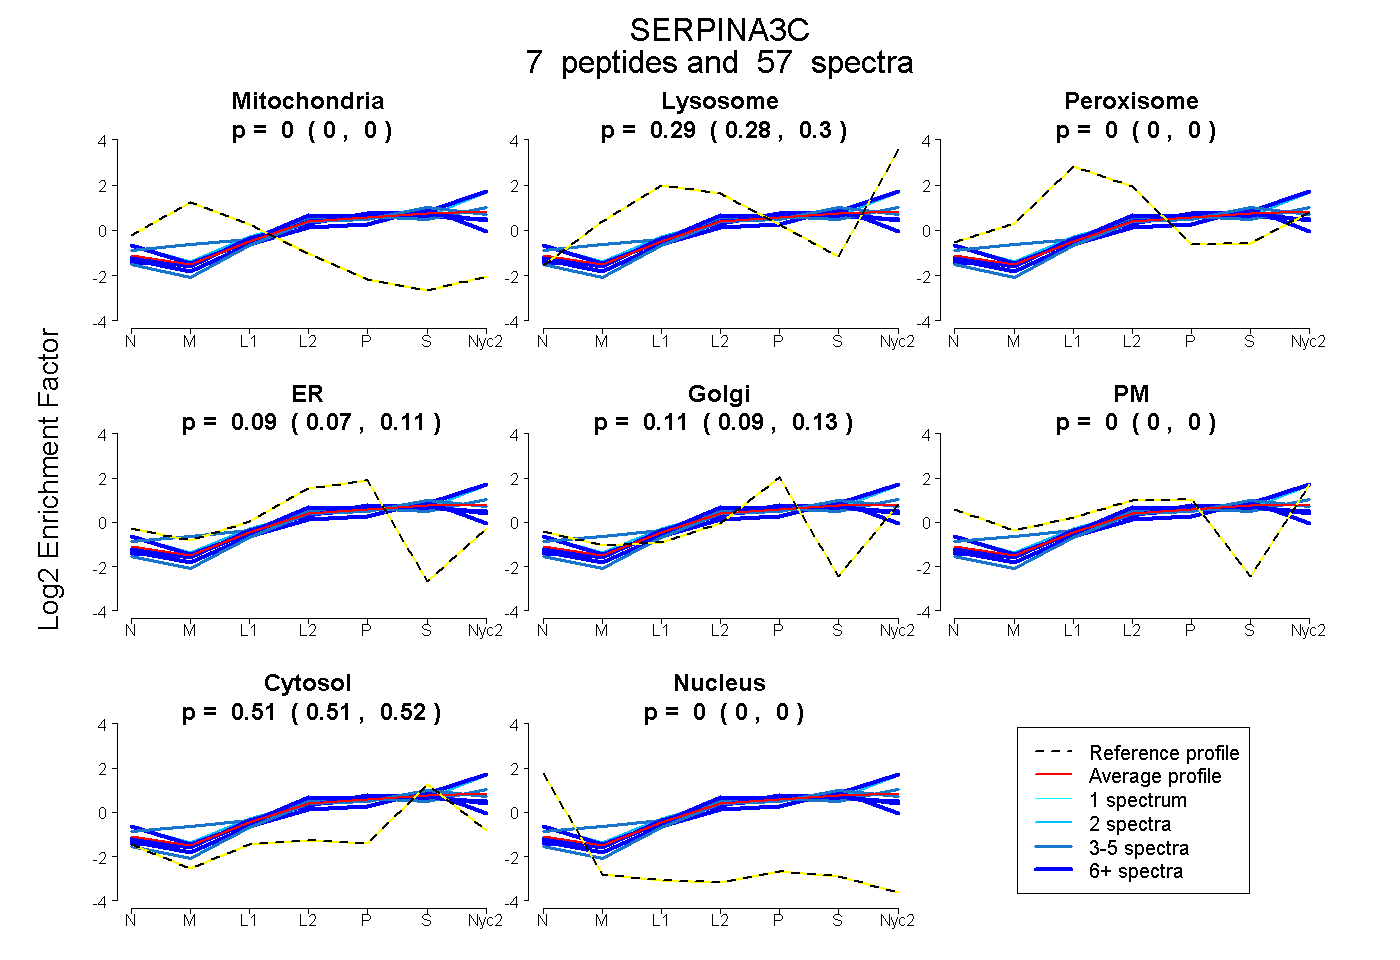
| Plot | Mito | Lyso | Perox | ER | Golgi | PM | Cytosol | Nucleus | |||||
| Expt A |
7 peptides |
57 spectra |
|
0.000 0.000 | 0.000 |
0.289 0.280 | 0.297 |
0.000 0.000 | 0.000 |
0.087 0.066 | 0.105 |
0.110 0.092 | 0.125 |
0.000 0.000 | 0.000 |
0.514 0.509 | 0.519 |
0.000 0.000 | 0.000 |
| 22 spectra, DTLPHEDQGK | 0.000 | 0.200 | 0.000 | 0.201 | 0.038 | 0.047 | 0.513 | 0.000 | ||
| 2 spectra, DLTTPYVR | 0.000 | 0.368 | 0.000 | 0.000 | 0.160 | 0.059 | 0.414 | 0.000 | ||
| 10 spectra, DEELSCSVLELK | 0.000 | 0.155 | 0.000 | 0.199 | 0.000 | 0.000 | 0.646 | 0.000 | ||
| 5 spectra, IFSQQADLSR | 0.000 | 0.355 | 0.000 | 0.106 | 0.123 | 0.000 | 0.416 | 0.000 | ||
| 4 spectra, QCNEAK | 0.000 | 0.256 | 0.000 | 0.070 | 0.077 | 0.000 | 0.597 | 0.000 | ||
| 8 spectra, NLHVSQVVHK | 0.000 | 0.229 | 0.000 | 0.199 | 0.042 | 0.000 | 0.530 | 0.000 | ||
| 6 spectra, LLESLR | 0.000 | 0.424 | 0.000 | 0.000 | 0.109 | 0.000 | 0.467 | 0.000 |
| Plot | Mito | Lyso or Perox | ER | Golgi | PM | Cytosol | Nucleus | ||||||
| Expt B |
6 peptides |
15 spectra |
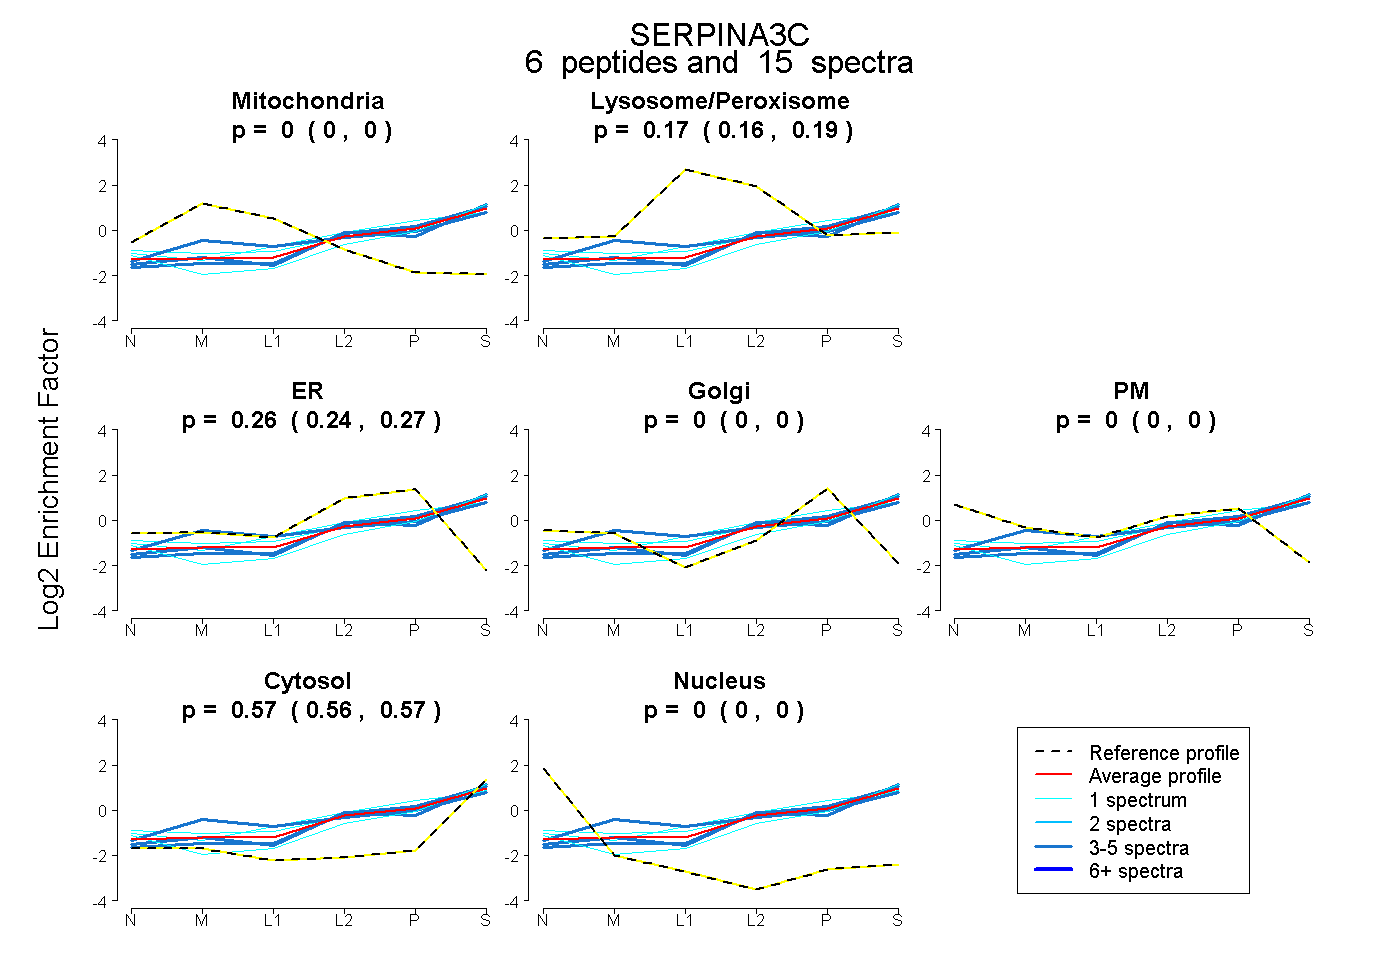 |
0.000 0.000 | 0.000 |
0.175 0.157 | 0.190 |
0.260 0.245 | 0.272 |
0.000 0.000 | 0.000 |
0.000 0.000 | 0.000 |
0.565 0.556 | 0.573 |
0.000 0.000 | 0.000 |
|||
| Plot | Lyso | Other | |||||||||||
| Expt C |
8 peptides |
124 spectra |
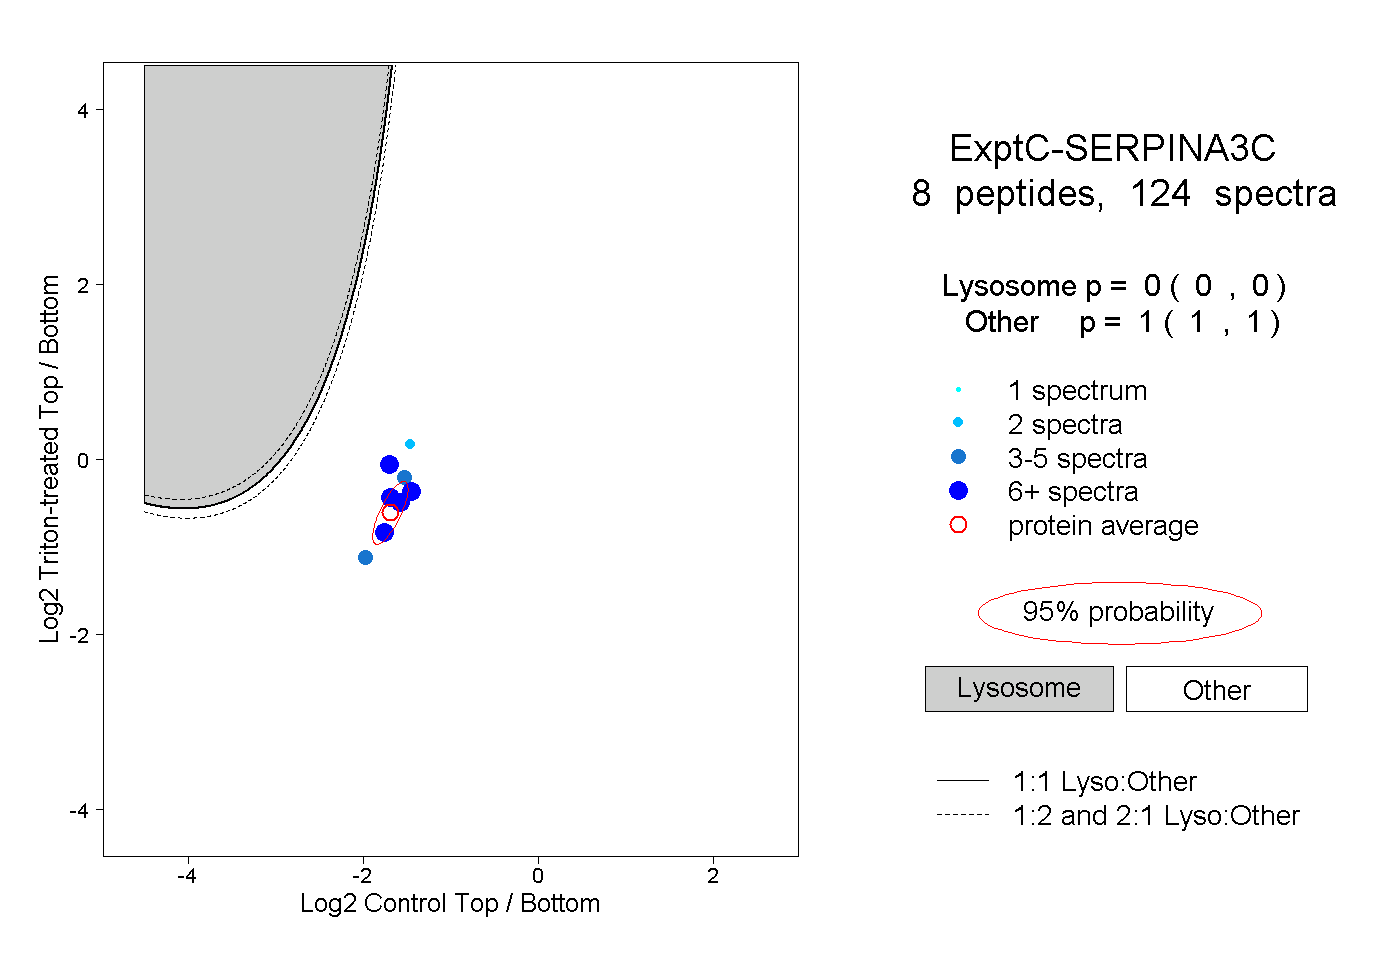 |
0.000 0.000 | 0.000 |
1.000 1.000 | 1.000 |
||||||||
| Plot | Lyso | Other | |||||||||||
| Expt D |
3 peptides |
12 spectra |
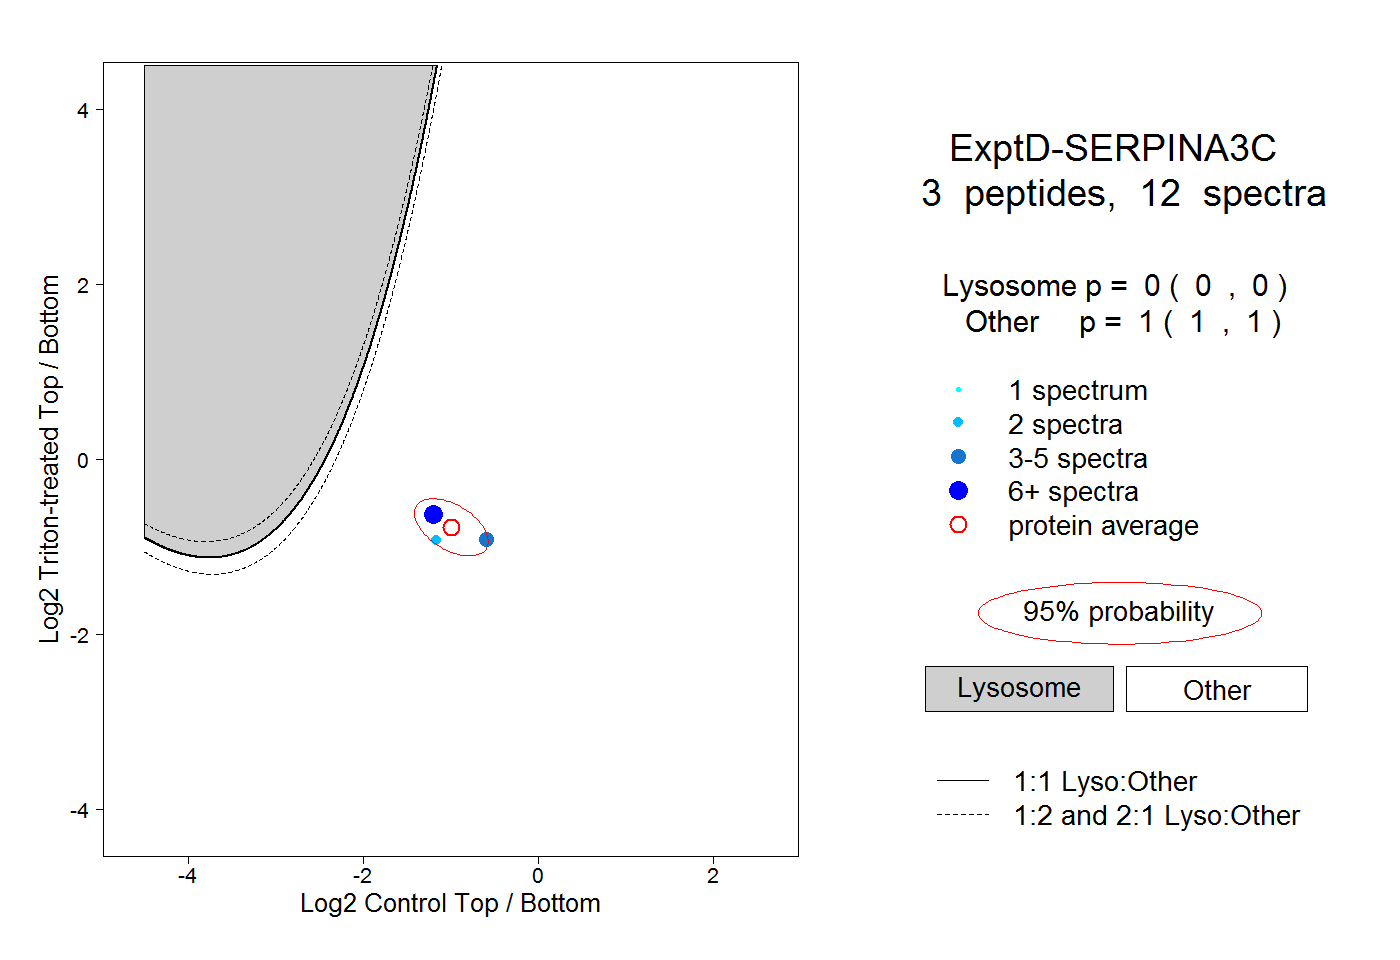 |
0.000 0.000 | 0.000 |
1.000 1.000 | 1.000 |