 4
4peptides
spectra
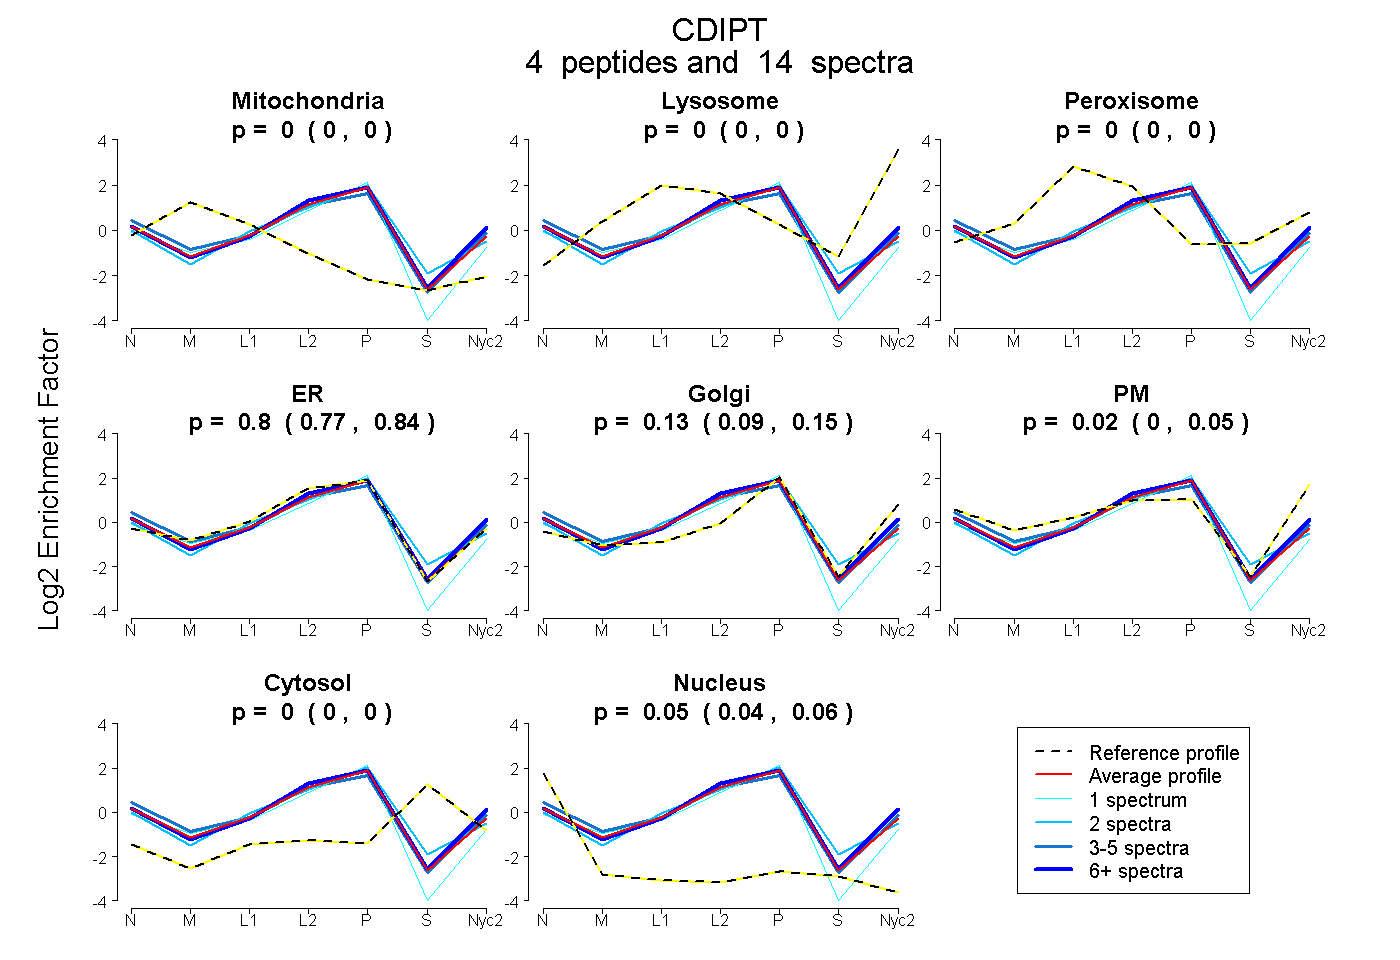
0.000 | 0.000
0.000 | 0.000
0.000 | 0.000
0.766 | 0.836
0.092 | 0.153
0.000 | 0.045
0.000 | 0.000
0.042 | 0.058
4peptides
spectra
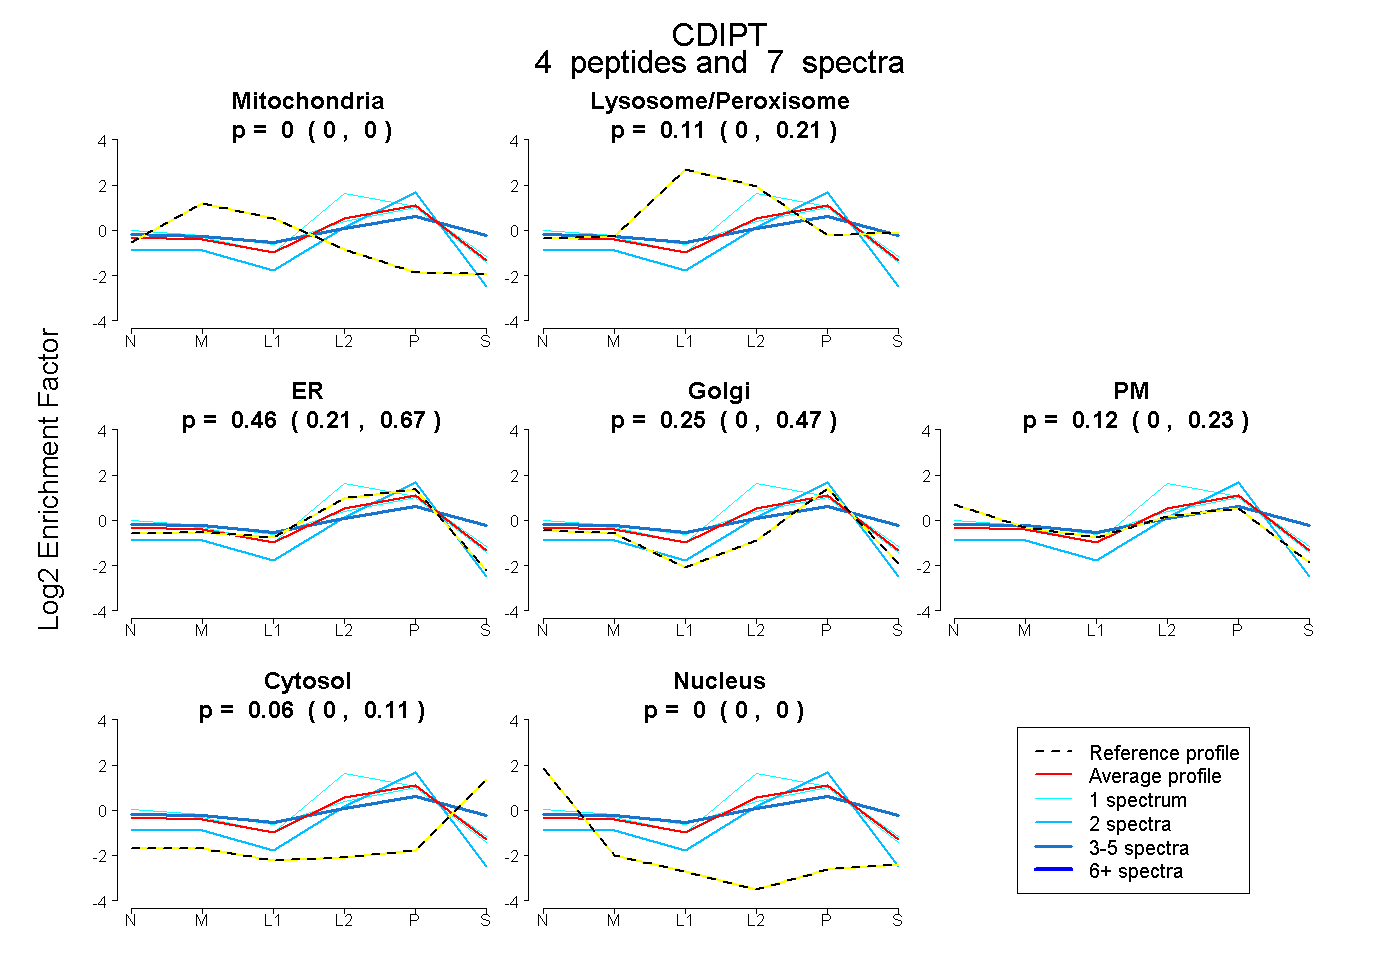
0.000 | 0.000
0.000 | 0.211
0.211 | 0.672
0.000 | 0.470
0.000 | 0.235
0.000 | 0.109
0.000 | 0.000
5peptides
spectra
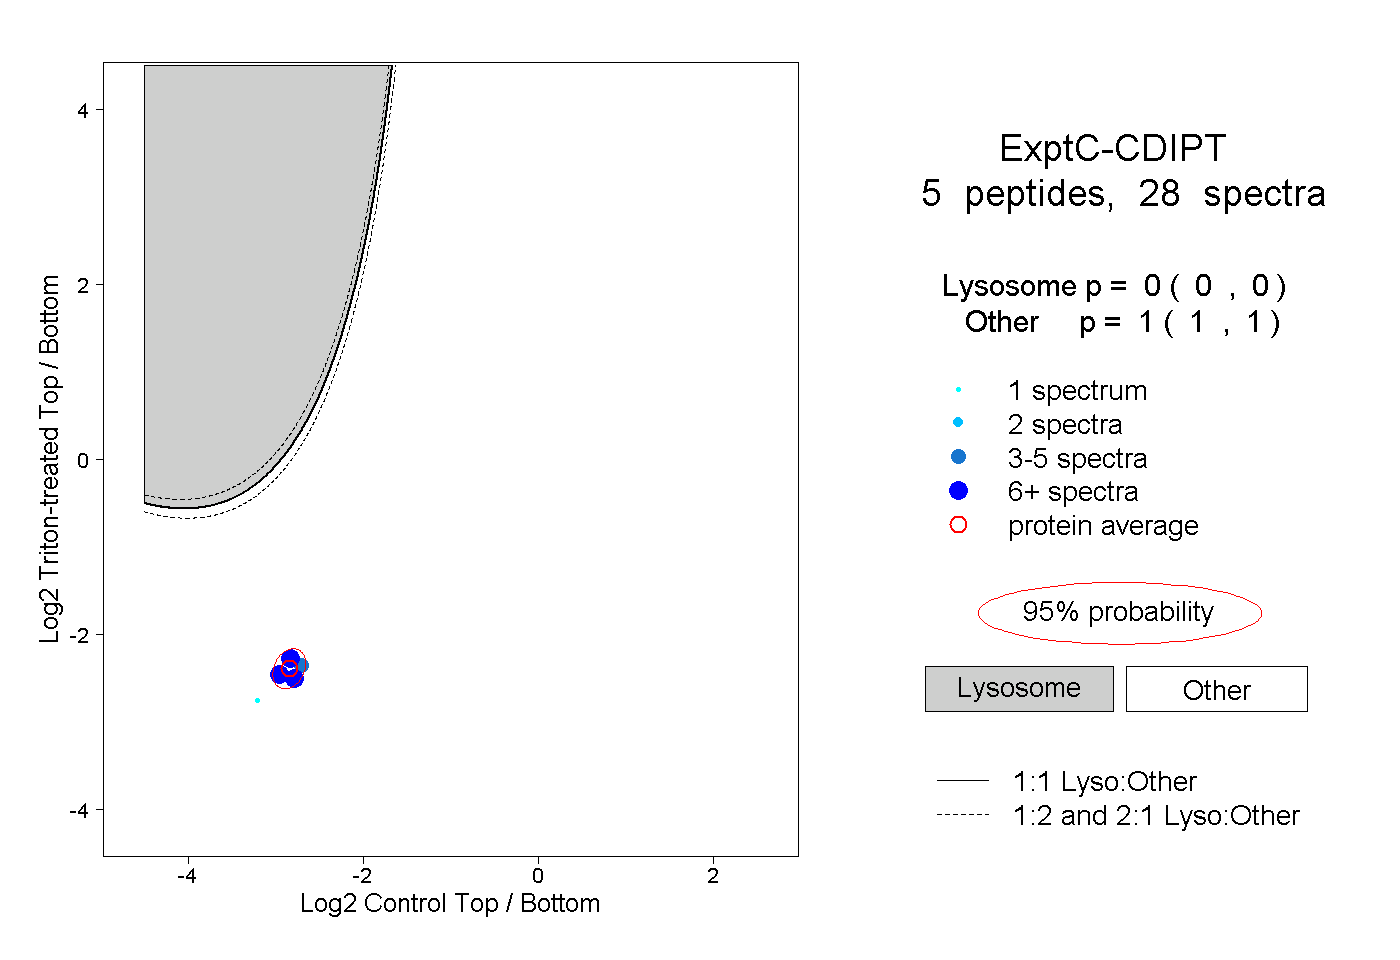
0.000 | 0.000
1.000 | 1.000