CDIPT
[ENSRNOP00000013691]
Main page
| | | Plot |
Mito |
Lyso |
|
Perox |
ER |
Golgi |
PM |
Cytosol |
Nucleus |
|
| Expt A |
 4
4
peptides |
14
spectra |
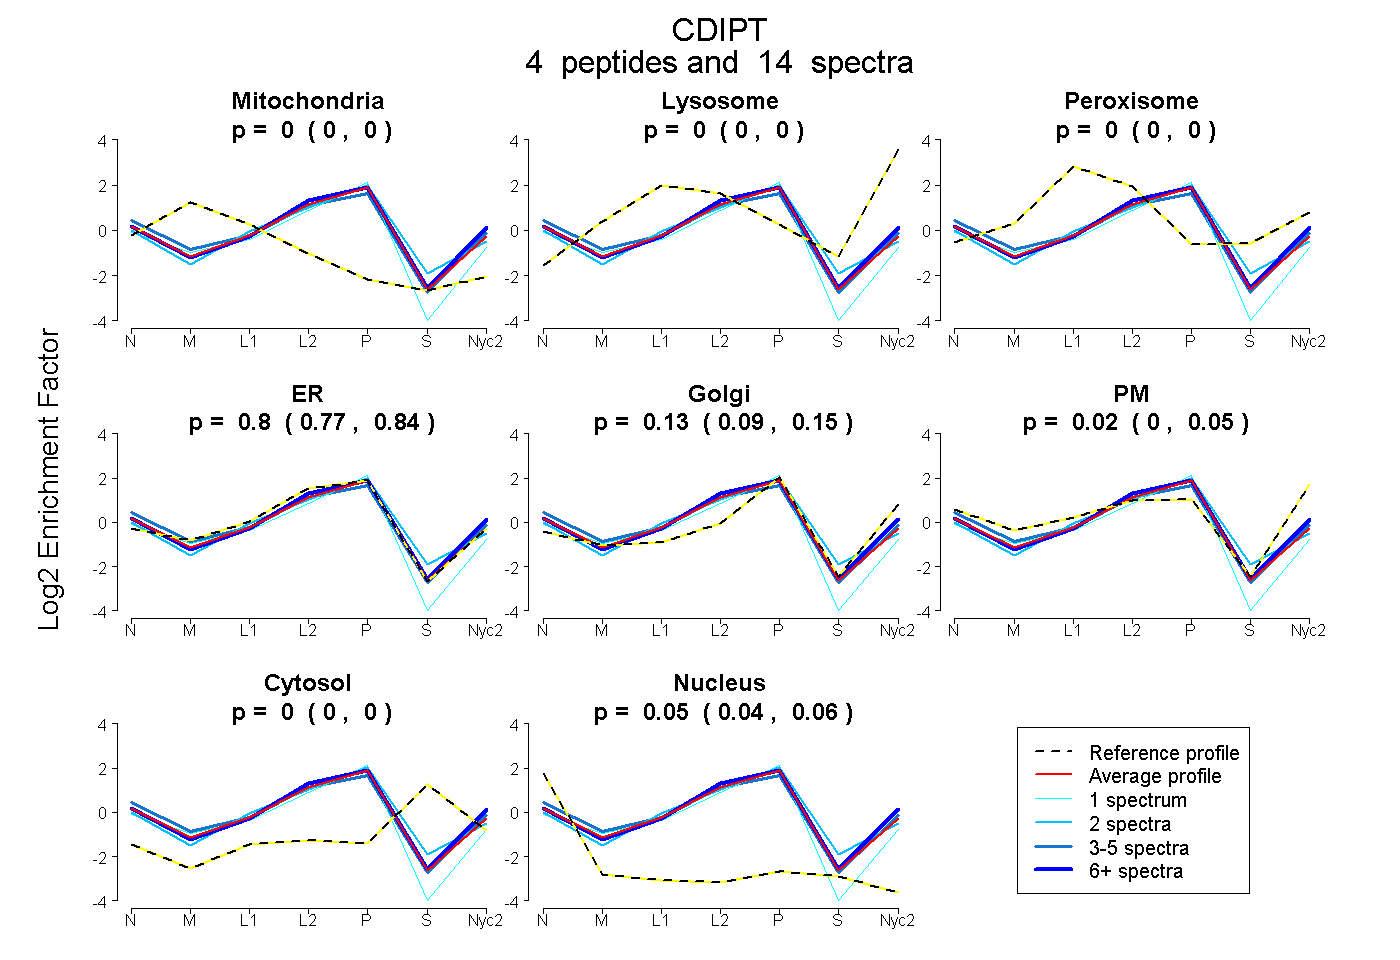 |
0.000
0.000 | 0.000 |
0.000
0.000 | 0.000 |
|
0.000
0.000 | 0.000 |
0.803
0.766 | 0.836 |
0.128
0.092 | 0.153 |
0.019
0.000 | 0.045 |
0.000
0.000 | 0.000 |
0.050
0.042 | 0.058 |
|
| | | Plot |
Mito |
|
Lyso or Perox |
|
ER |
Golgi |
PM |
Cytosol |
Nucleus |
|
| Expt B |
4
peptides |
7
spectra |
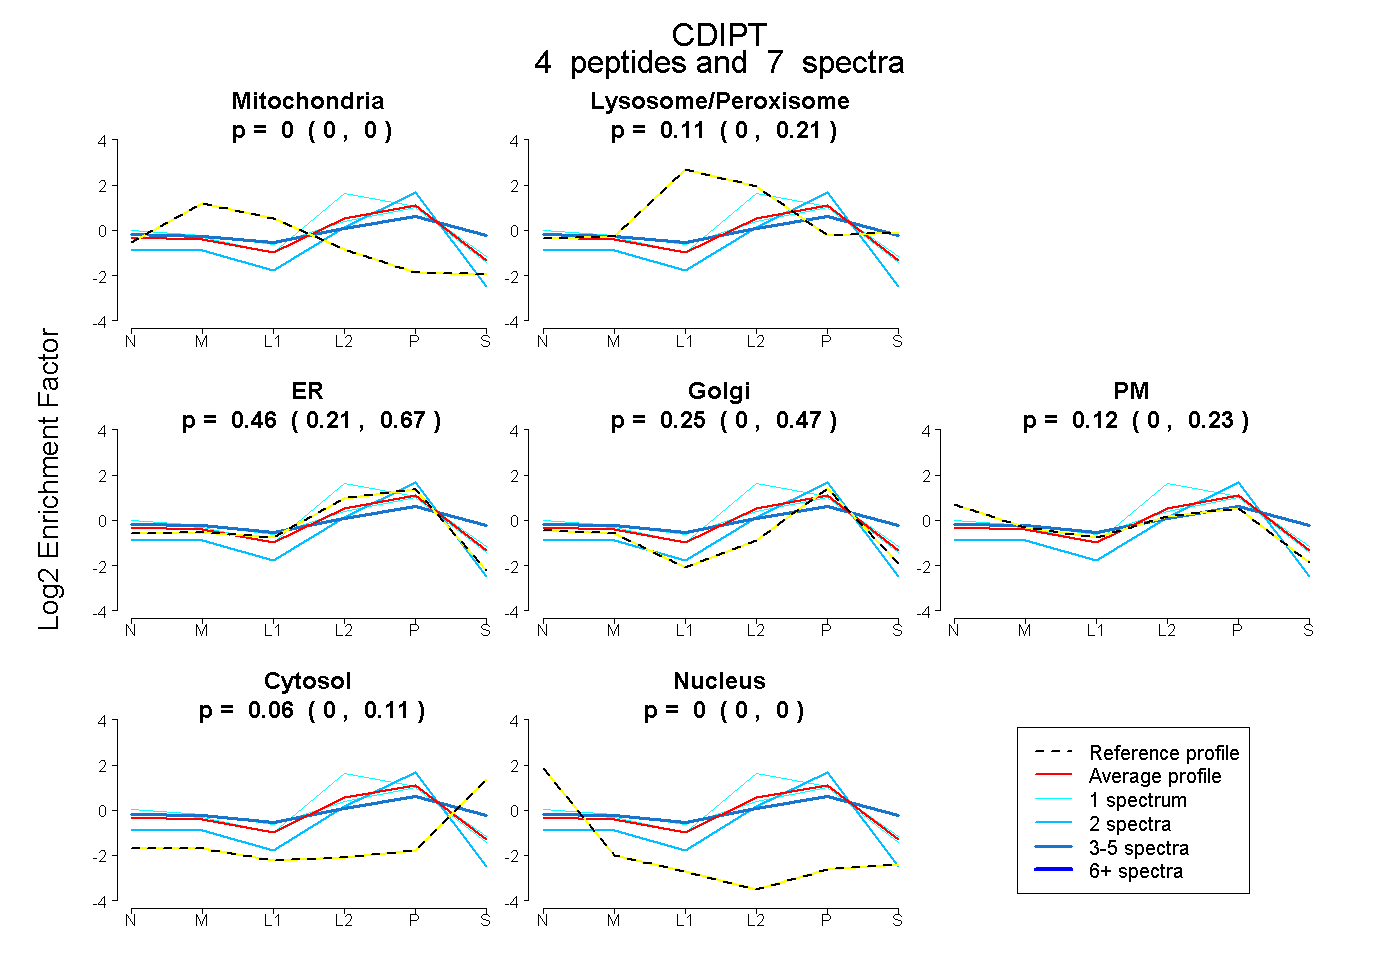 |
0.000
0.000 | 0.000 |
|
0.113
0.000 | 0.211 |
|
0.458
0.211 | 0.672 |
0.250
0.000 | 0.470 |
0.120
0.000 | 0.235 |
0.059
0.000 | 0.109 |
0.000
0.000 | 0.000 |
|
| 1 spectrum, FGAMLDMLTDR |
0.000 |
|
0.123 |
|
0.723 |
0.000 |
0.119 |
0.035 |
0.000 |
|
| 3 spectra, SIISVIHLVTAAR |
0.000 |
|
0.330 |
|
0.000 |
0.399 |
0.116 |
0.154 |
0.000 |
|
| 1 spectrum, GSESHK |
0.000 |
|
0.186 |
|
0.182 |
0.313 |
0.319 |
0.000 |
0.000 |
|
| 2 spectra, NMAALDAADR |
0.000 |
|
0.000 |
|
0.466 |
0.534 |
0.000 |
0.000 |
0.000 |
|
| | | Plot |
|
Lyso |
|
|
|
|
|
|
|
Other |
| Expt C |
5
peptides |
28
spectra |
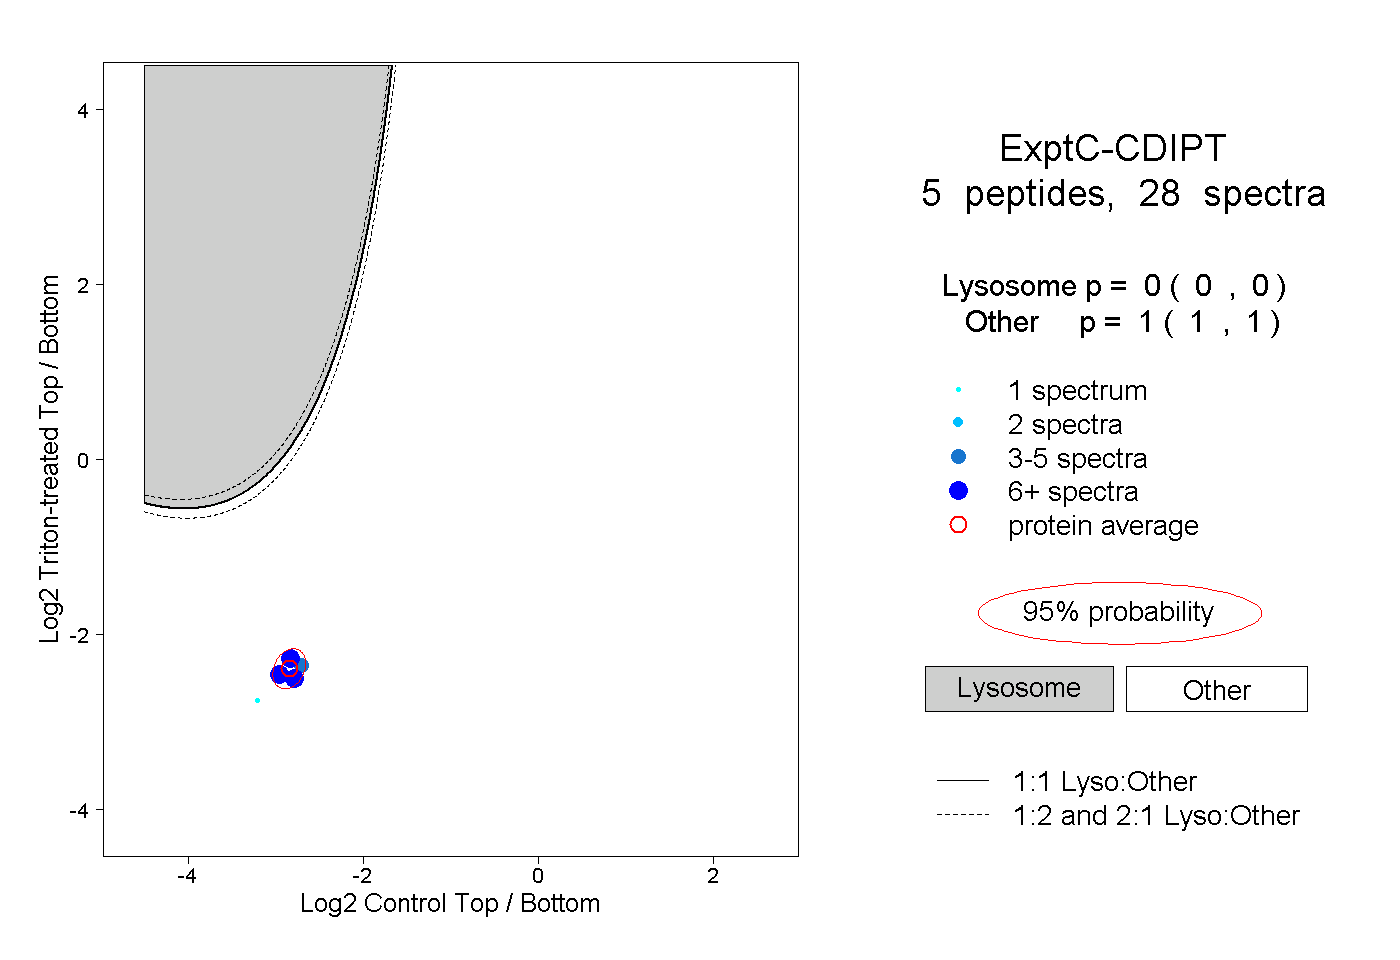 |
|
0.000
0.000 | 0.000 |
|
|
|
|
|
|
|
1.000
1.000 | 1.000 |