 4
4peptides
spectra
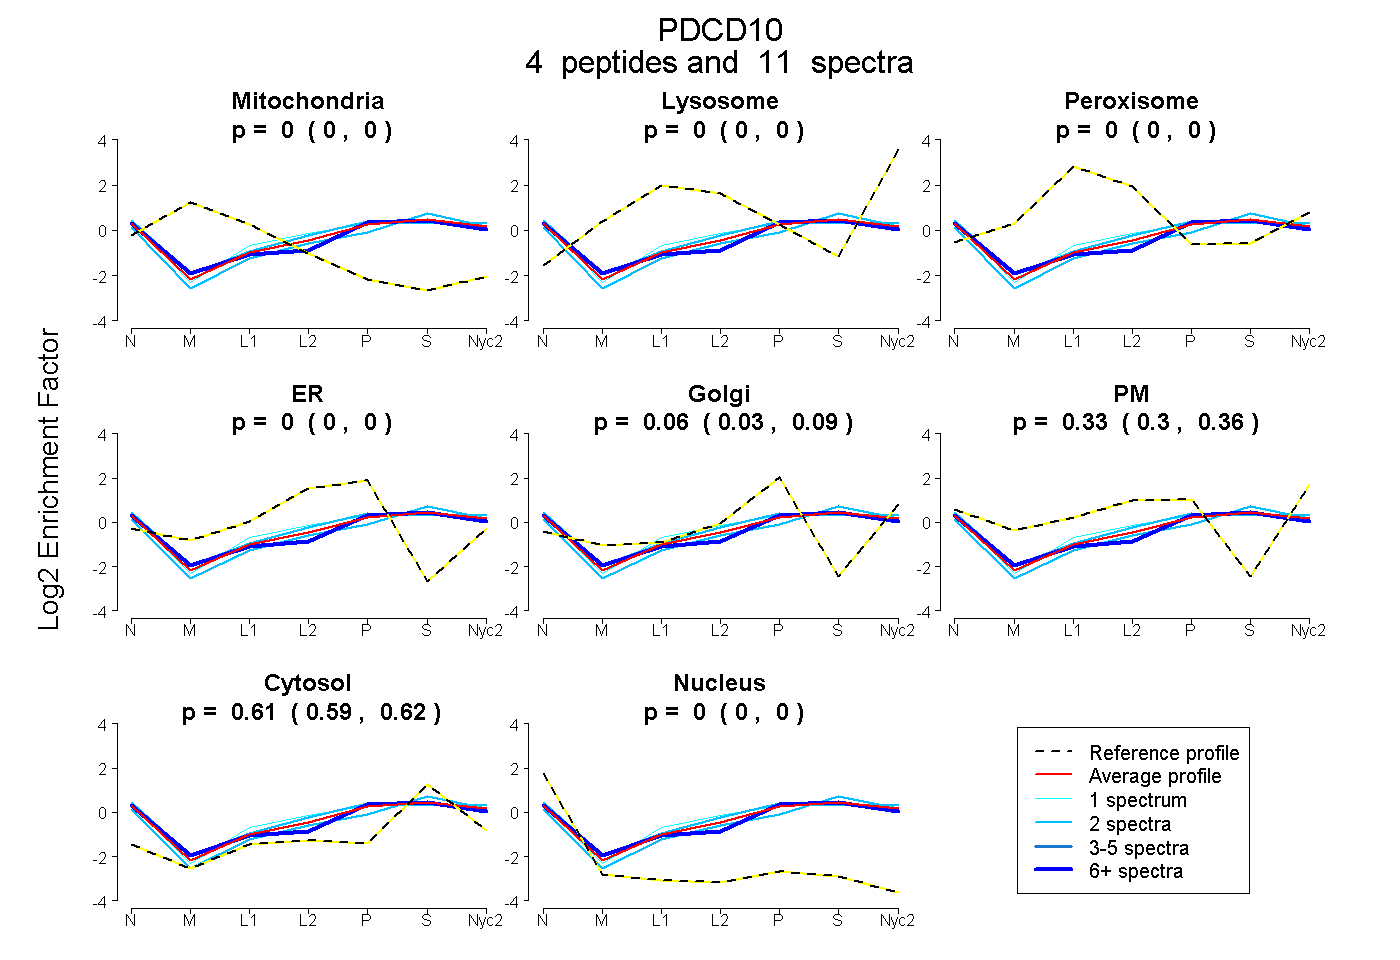
0.000 | 0.000
0.000 | 0.000
0.000 | 0.000
0.000 | 0.000
0.029 | 0.092
0.298 | 0.357
0.594 | 0.615
0.000 | 0.003
1peptide
spectra
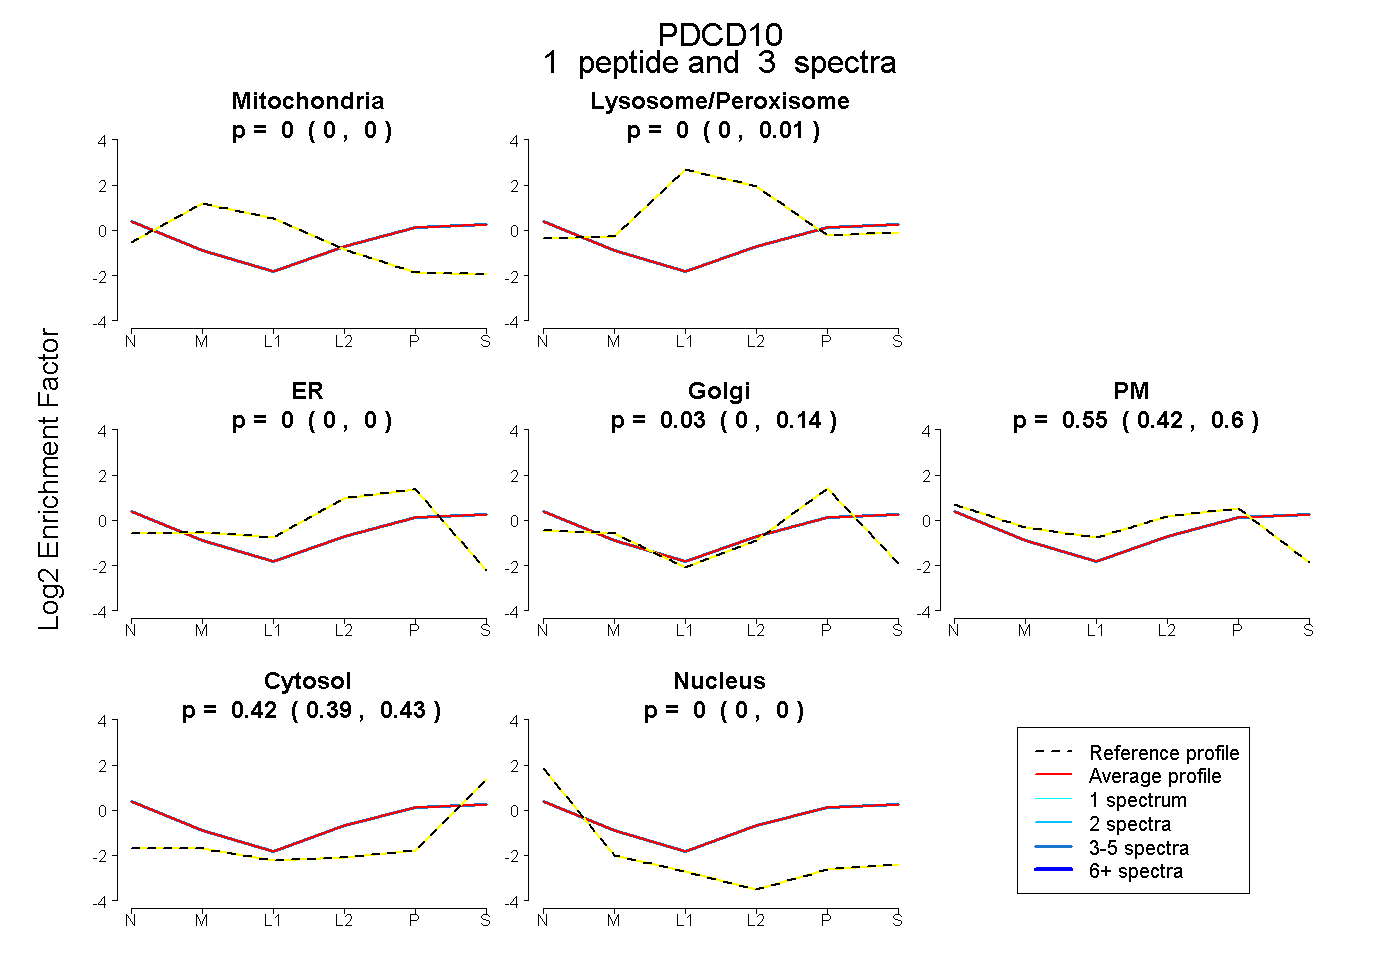
0.000 | 0.000
0.000 | 0.014
0.000 | 0.000
0.000 | 0.142
0.419 | 0.599
0.390 | 0.429
0.000 | 0.000
4peptides
spectra
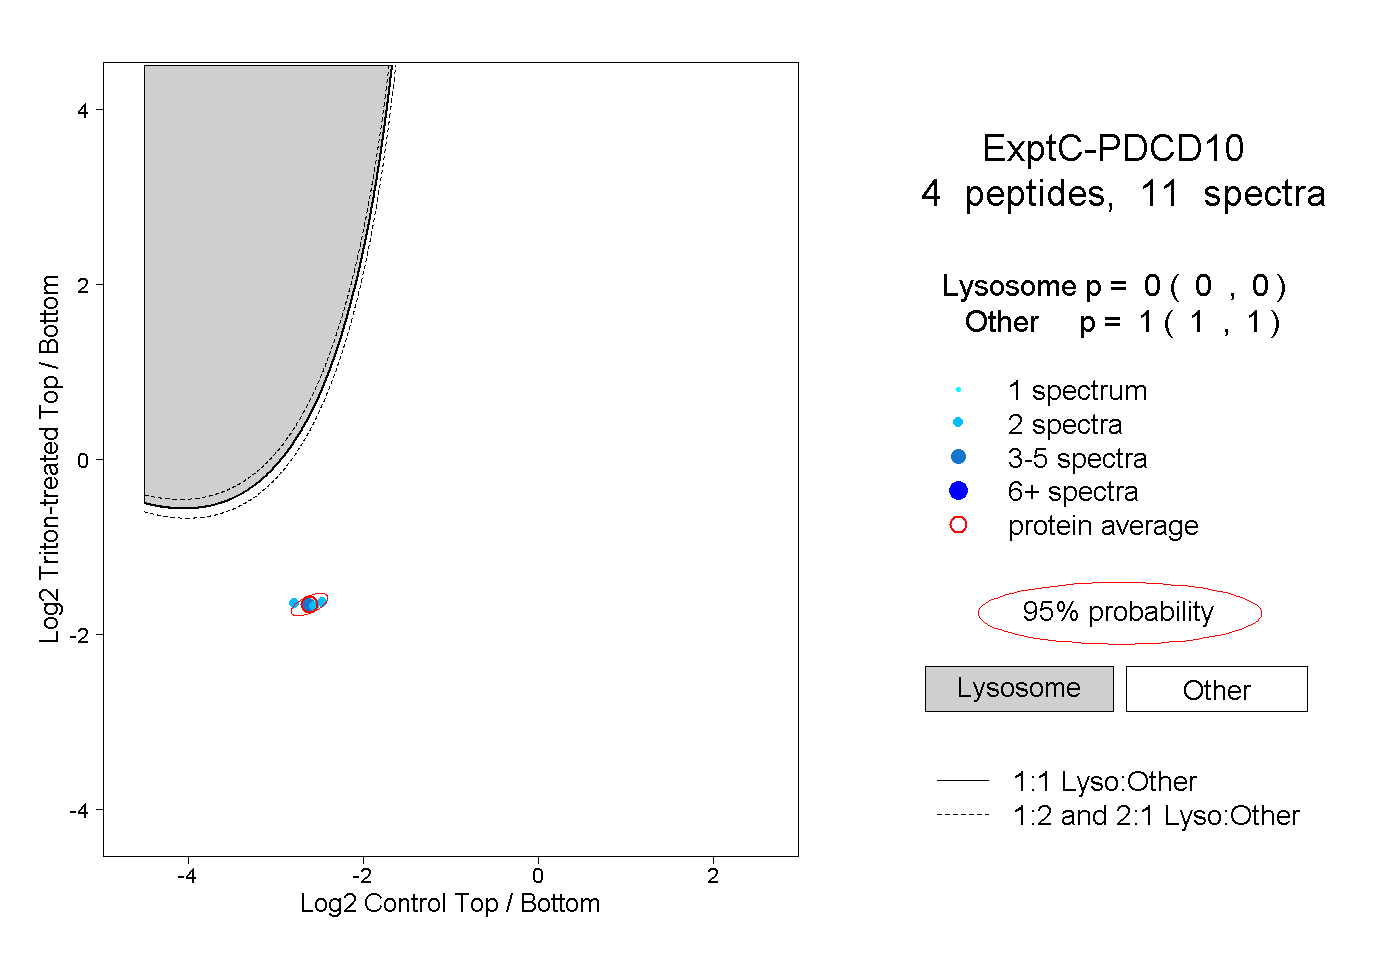
0.000 | 0.000
1.000 | 1.000
2peptides
spectra
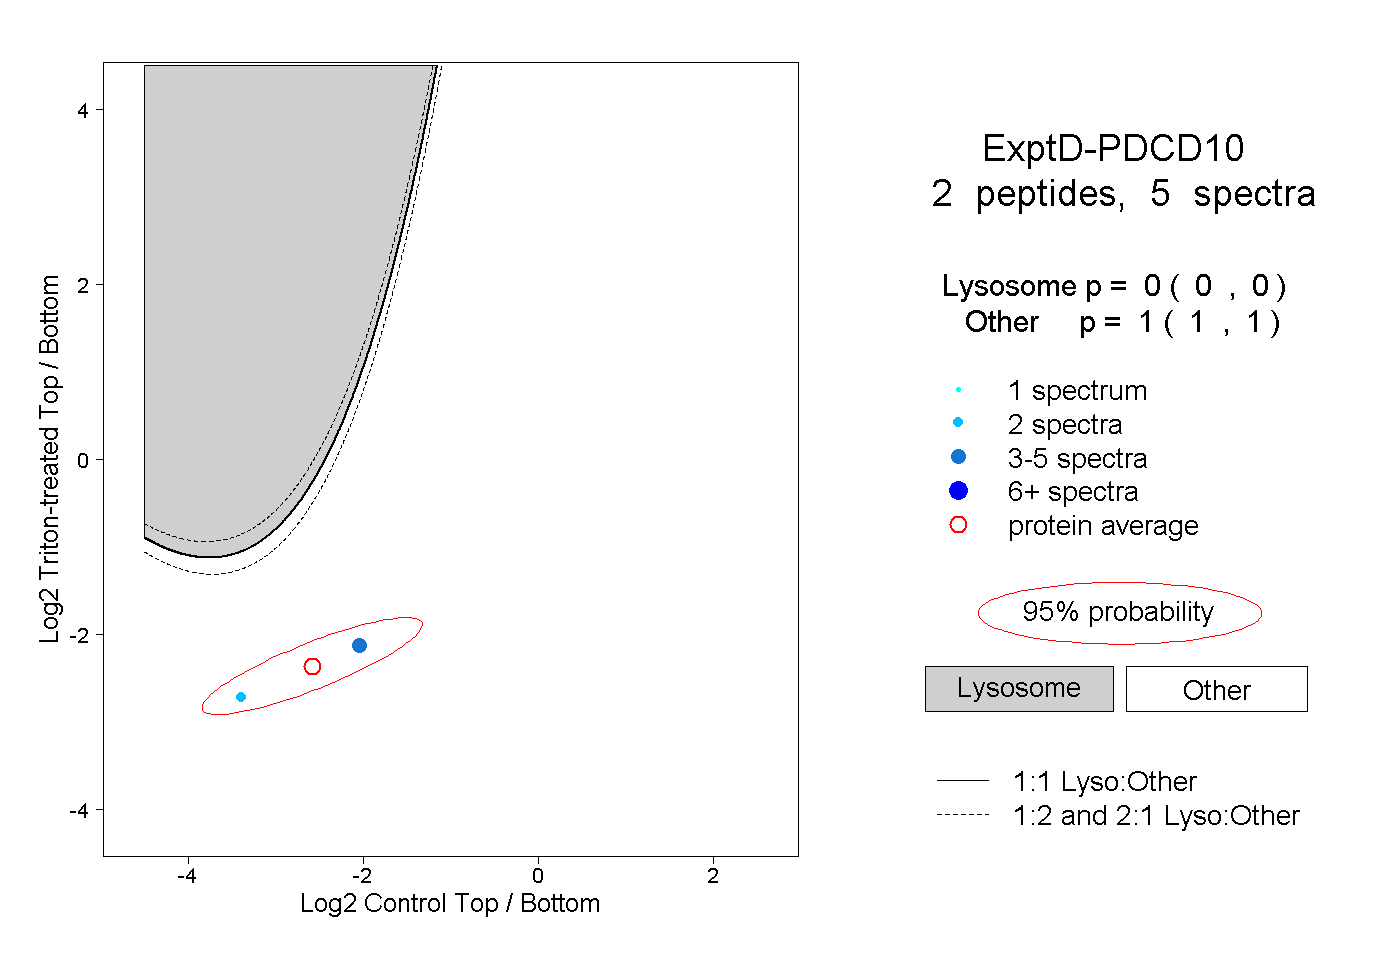
0.000 | 0.000
1.000 | 1.000