 4
4peptides
spectra
0.000 | 0.000
0.000 | 0.000
0.000 | 0.000
0.000 | 0.000
0.029 | 0.092
0.298 | 0.357
0.594 | 0.615
0.000 | 0.003
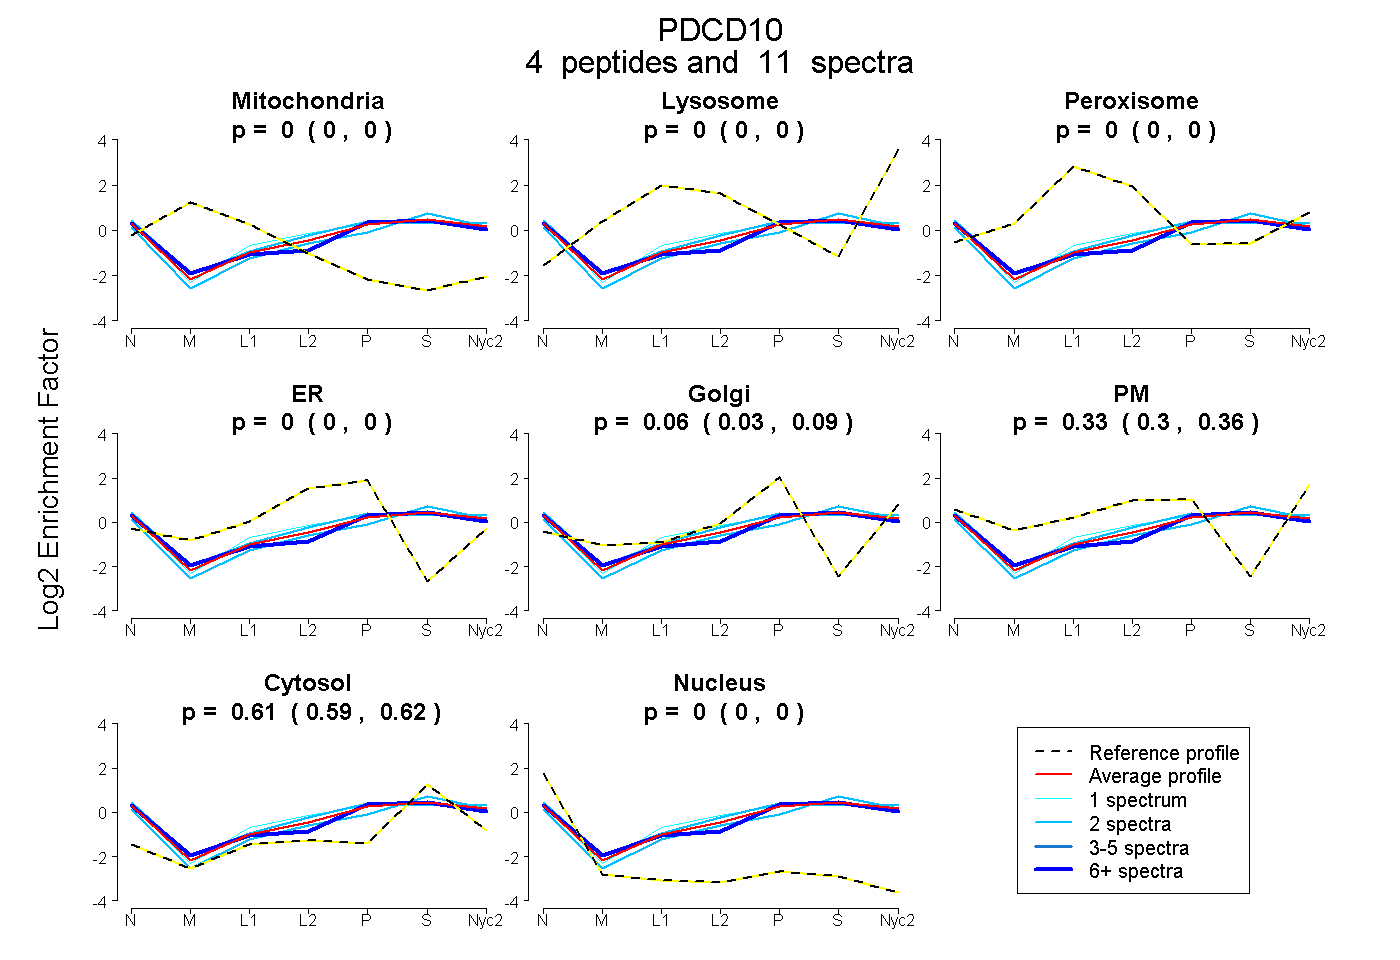
| Plot | Mito | Lyso | Perox | ER | Golgi | PM | Cytosol | Nucleus | |||||
| Expt A |
4 peptides |
11 spectra |
|
0.000 0.000 | 0.000 |
0.000 0.000 | 0.000 |
0.000 0.000 | 0.000 |
0.000 0.000 | 0.000 |
0.064 0.029 | 0.092 |
0.331 0.298 | 0.357 |
0.606 0.594 | 0.615 |
0.000 0.000 | 0.003 |
| 6 spectra, YQYQNR | 0.000 | 0.000 | 0.000 | 0.000 | 0.164 | 0.235 | 0.583 | 0.018 | ||
| 2 spectra, VNLSAAQTLR | 0.000 | 0.000 | 0.000 | 0.000 | 0.052 | 0.404 | 0.544 | 0.000 | ||
| 1 spectrum, IPDEINDR | 0.000 | 0.000 | 0.000 | 0.002 | 0.000 | 0.421 | 0.577 | 0.000 | ||
| 2 spectra, AINVFISANR | 0.000 | 0.000 | 0.000 | 0.000 | 0.039 | 0.262 | 0.698 | 0.000 |
| Plot | Mito | Lyso or Perox | ER | Golgi | PM | Cytosol | Nucleus | ||||||
| Expt B |
1 peptide |
3 spectra |
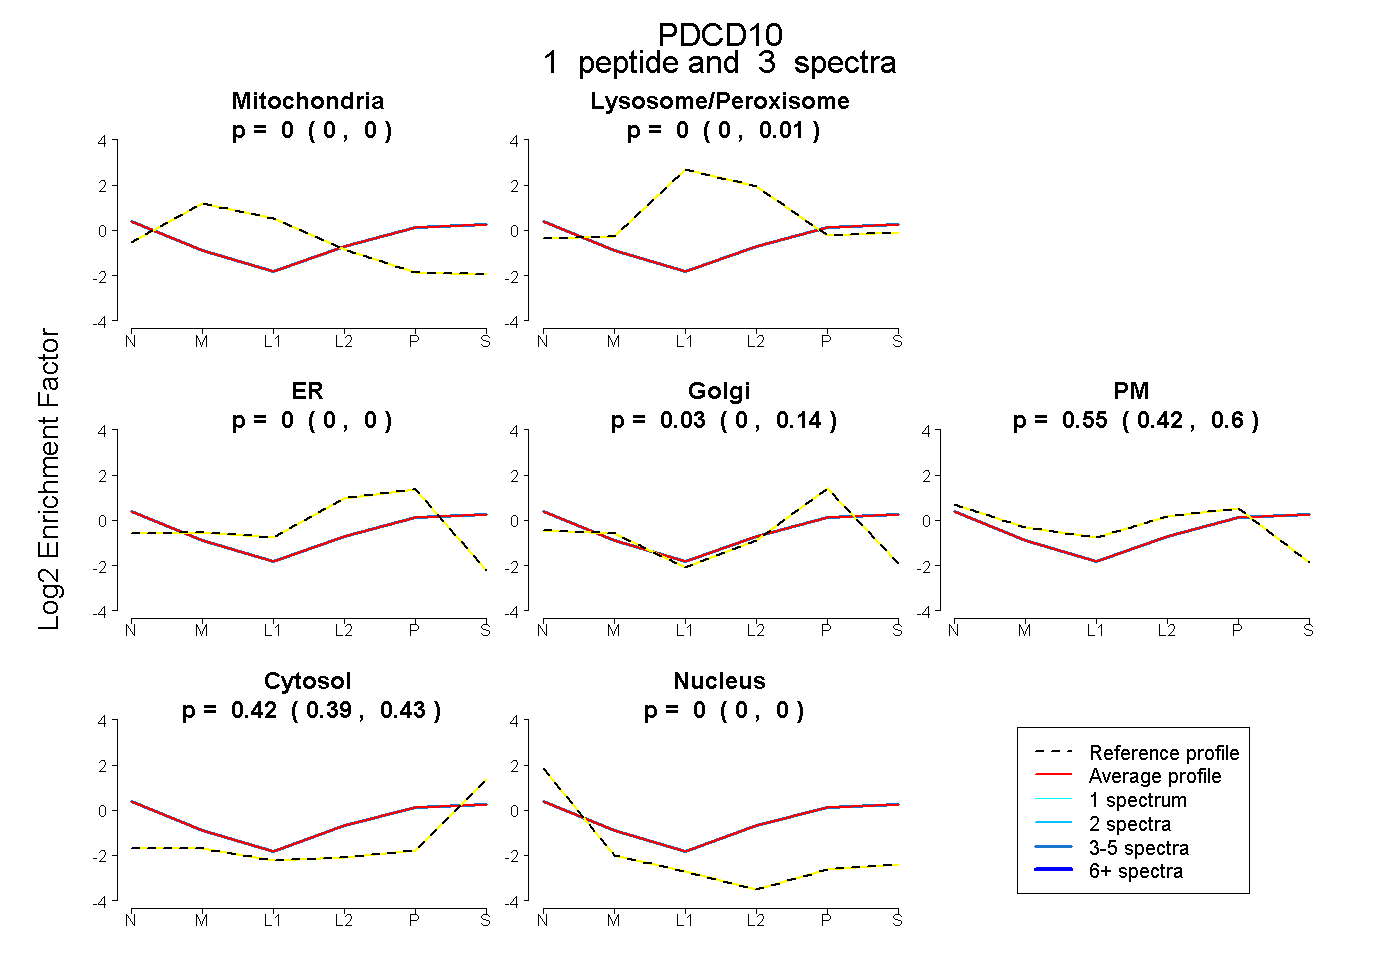 |
0.000 0.000 | 0.000 |
0.000 0.000 | 0.014 |
0.000 0.000 | 0.000 |
0.033 0.000 | 0.142 |
0.552 0.419 | 0.599 |
0.415 0.390 | 0.429 |
0.000 0.000 | 0.000 |
|||
| Plot | Lyso | Other | |||||||||||
| Expt C |
4 peptides |
11 spectra |
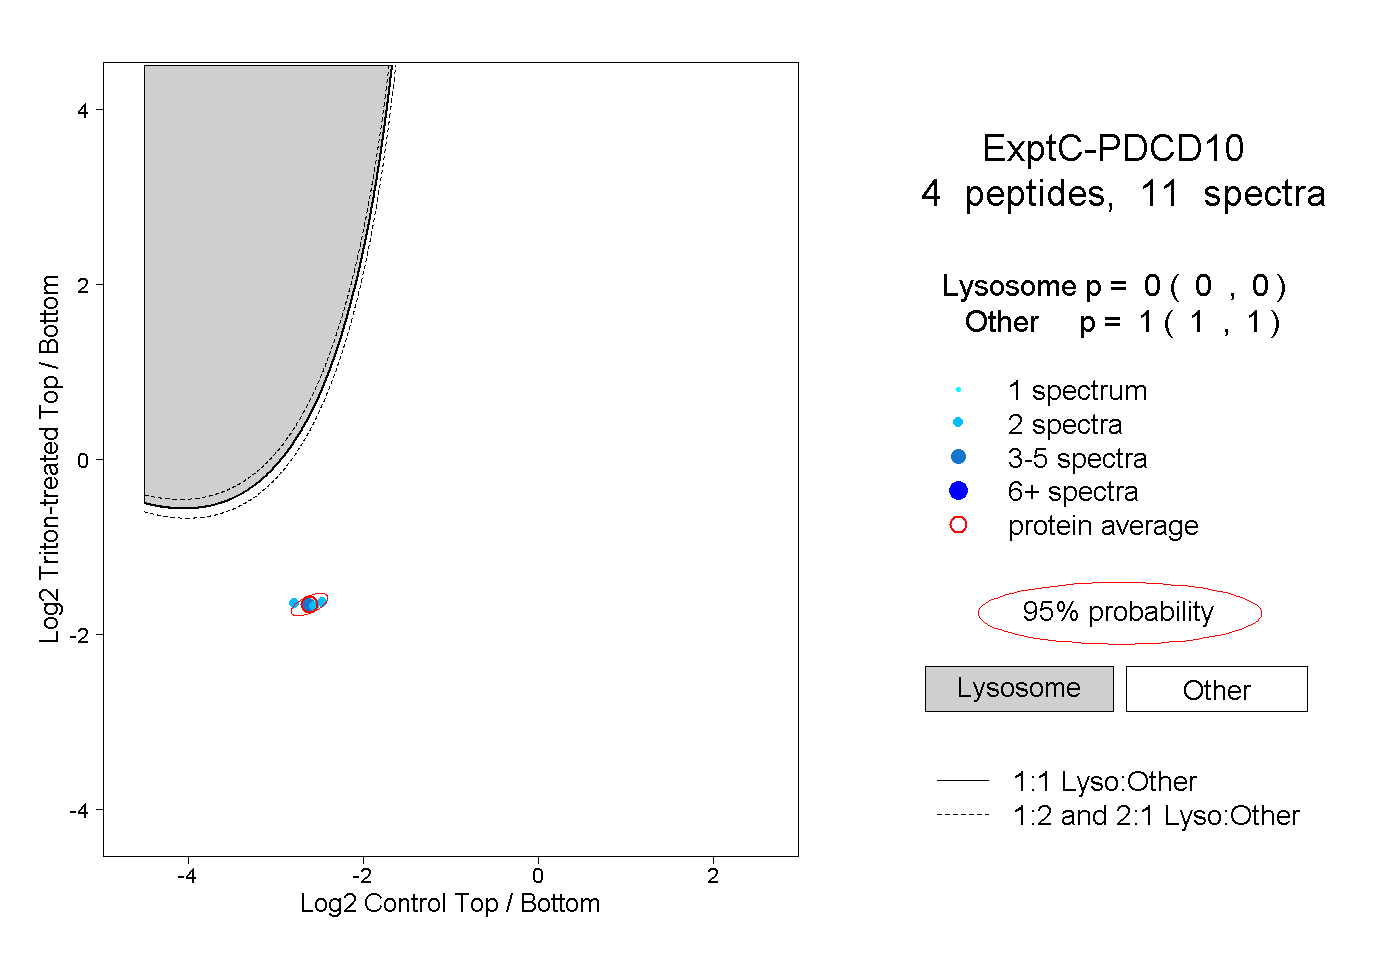 |
0.000 0.000 | 0.000 |
1.000 1.000 | 1.000 |
||||||||
| Plot | Lyso | Other | |||||||||||
| Expt D |
2 peptides |
5 spectra |
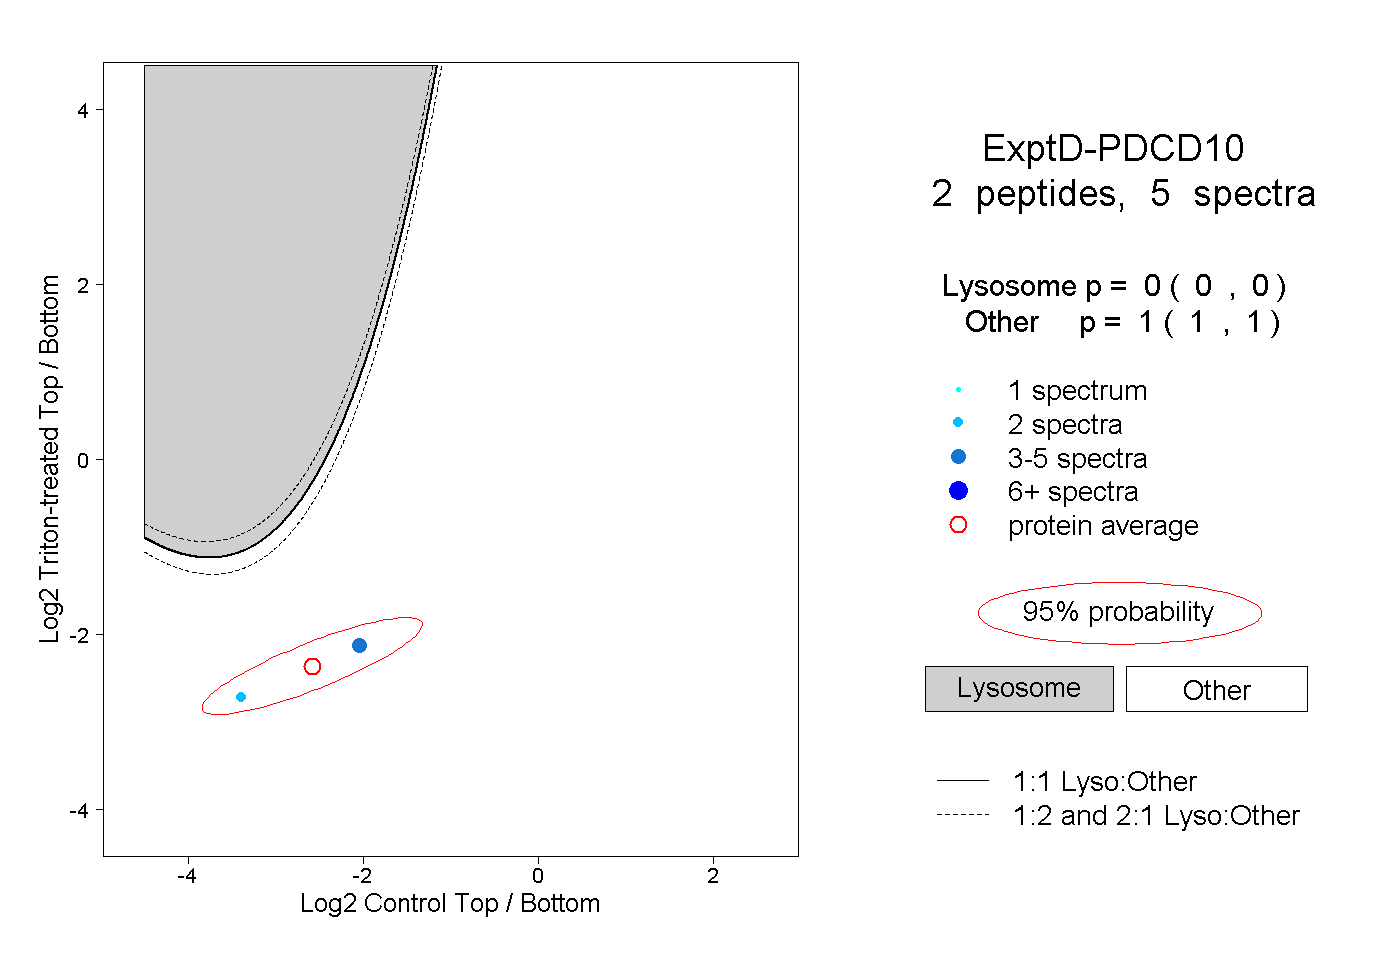 |
0.000 0.000 | 0.000 |
1.000 1.000 | 1.000 |