 4
4peptides
spectra
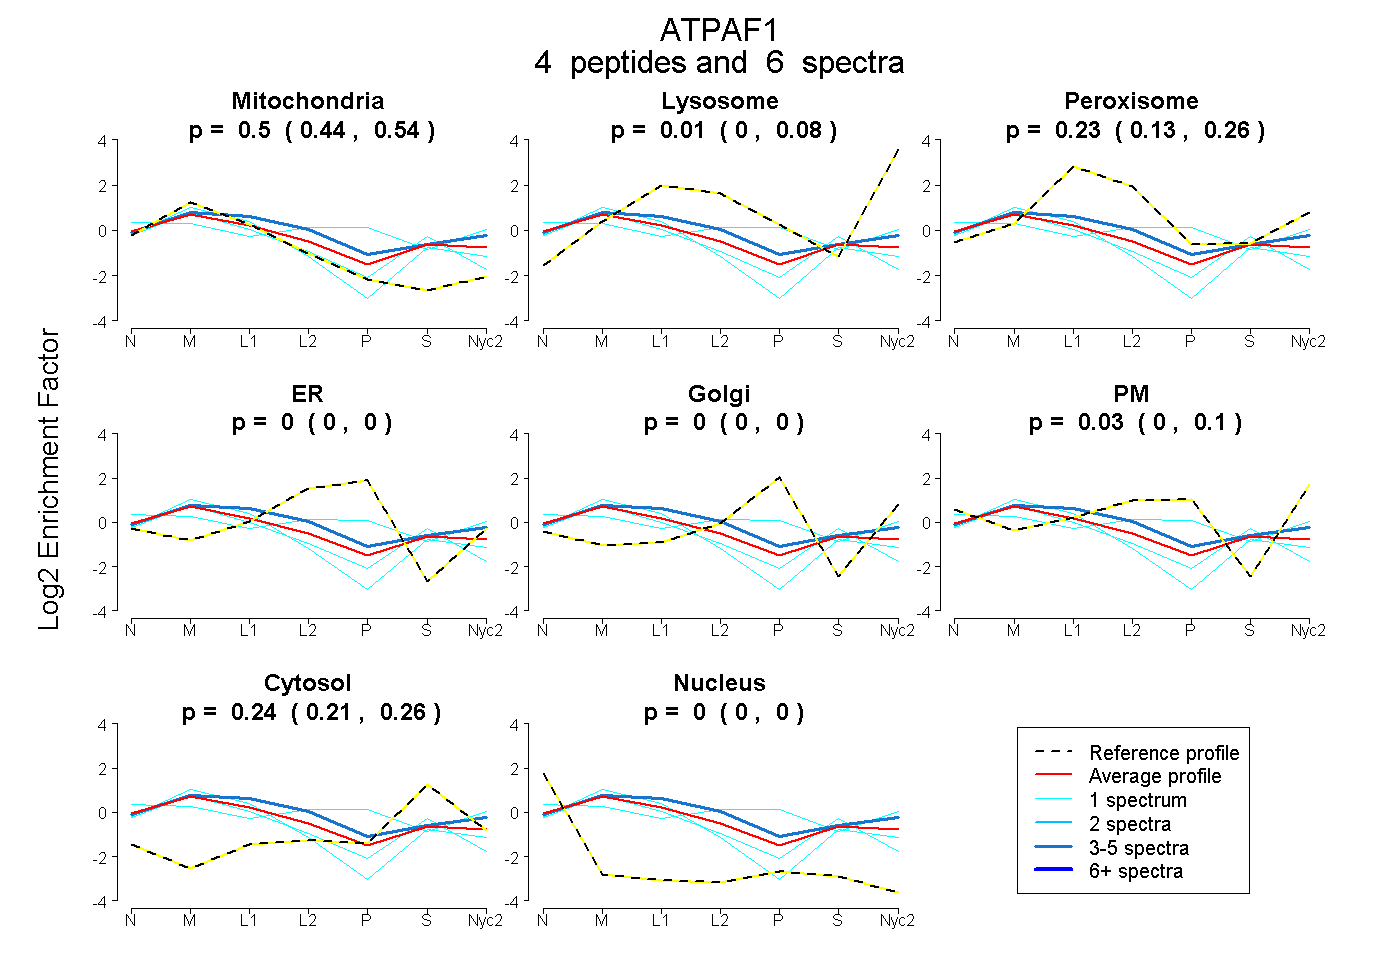
0.438 | 0.544
0.000 | 0.077
0.133 | 0.261
0.000 | 0.000
0.000 | 0.000
0.000 | 0.100
0.215 | 0.258
0.000 | 0.000
6peptides
spectra
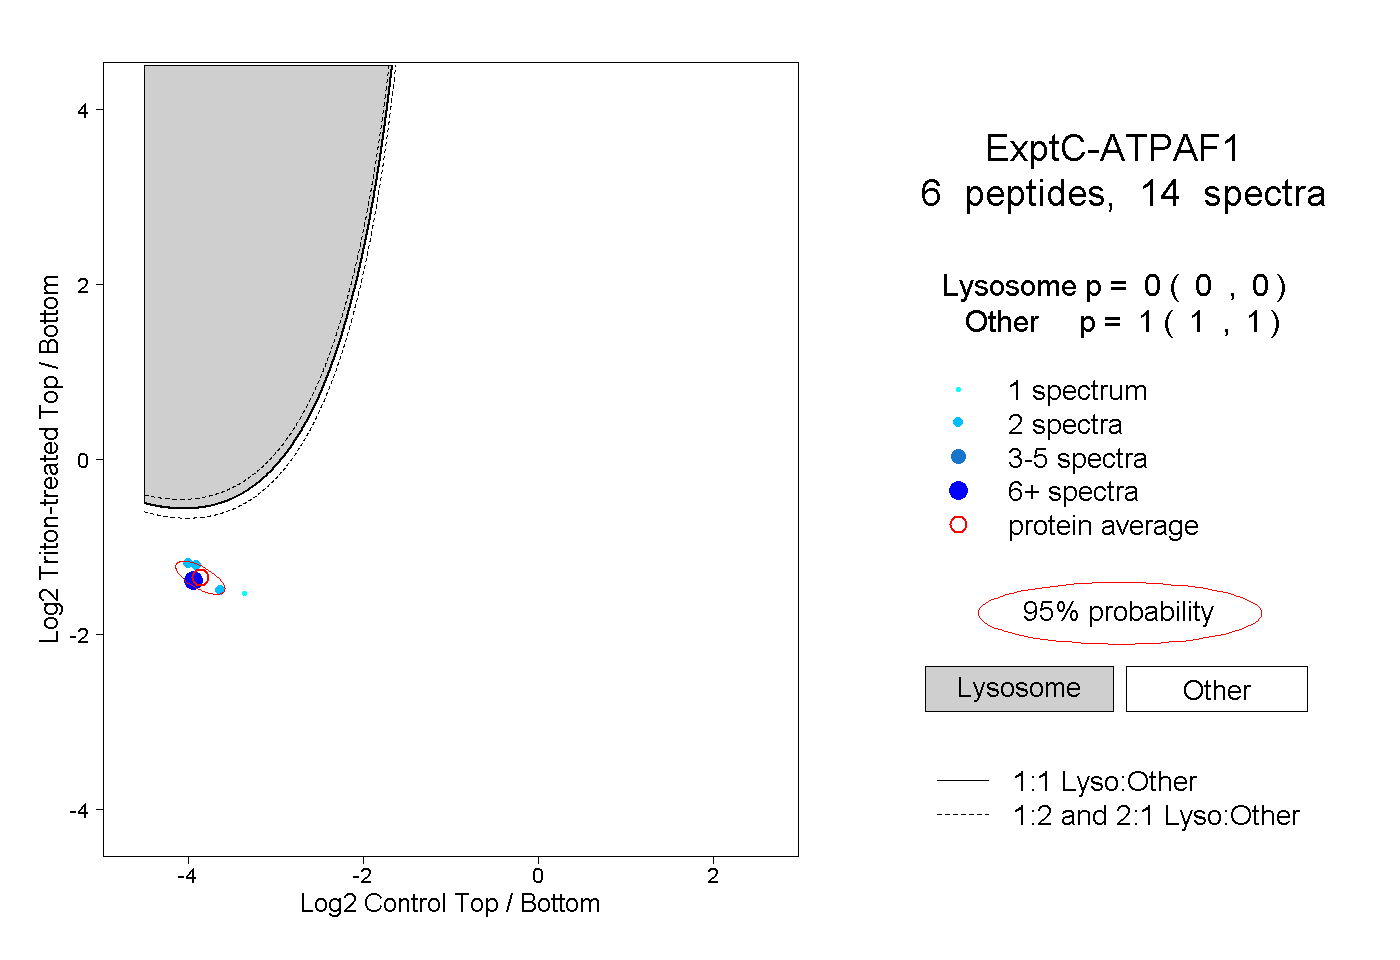
0.000 | 0.000
1.000 | 1.000
1peptide
spectrum
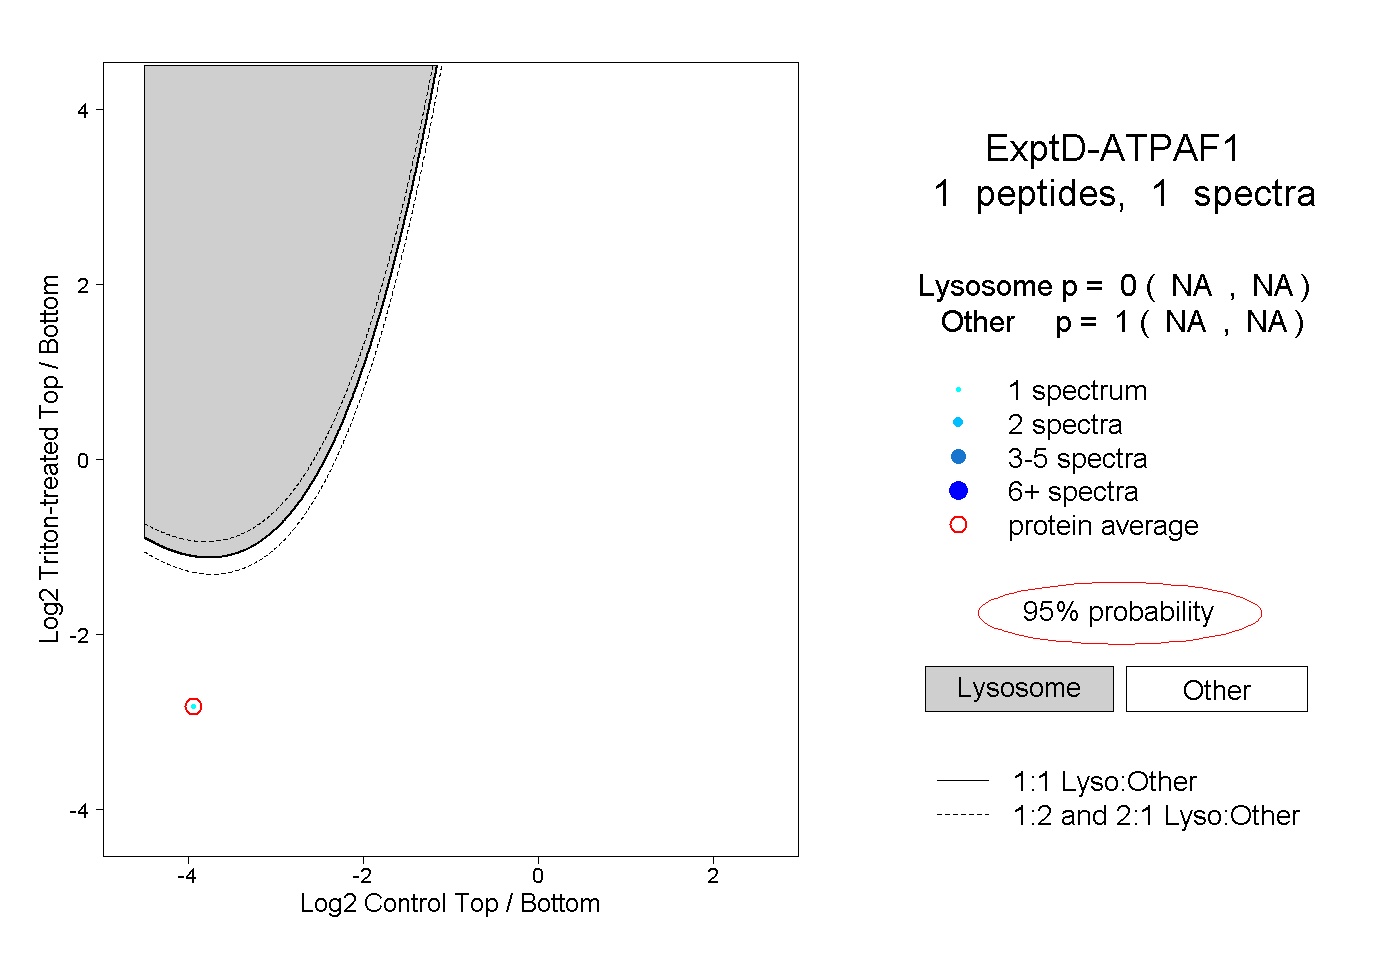
NA | NA
NA | NA