 4
4peptides
spectra
0.438 | 0.544
0.000 | 0.077
0.133 | 0.261
0.000 | 0.000
0.000 | 0.000
0.000 | 0.100
0.215 | 0.258
0.000 | 0.000
| Plot | Mito | Lyso | Perox | ER | Golgi | PM | Cytosol | Nucleus | |||||
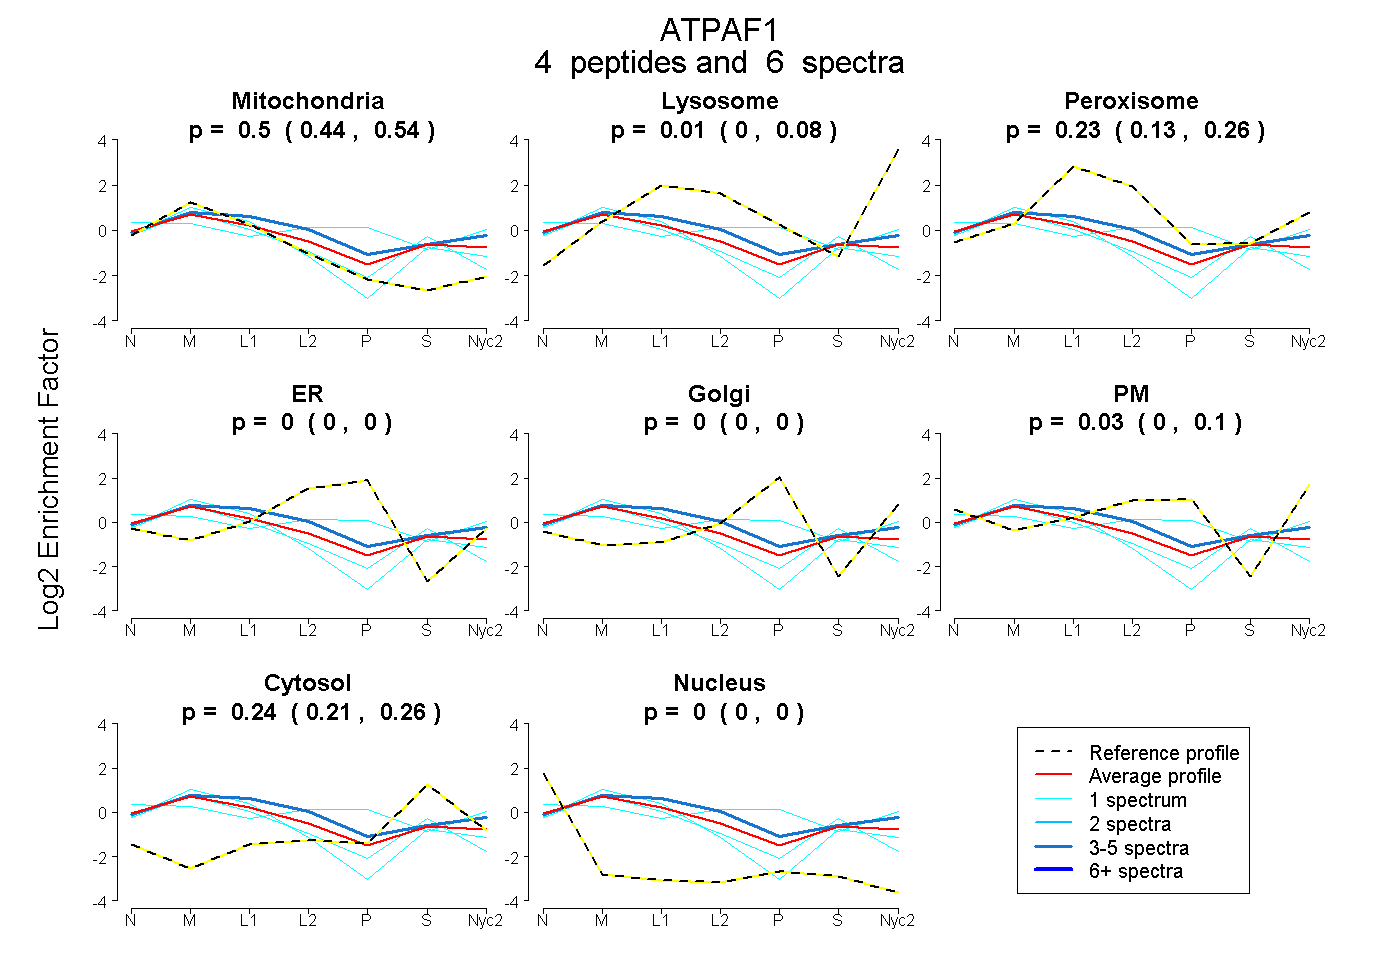
| Expt A |
4 peptides |
6 spectra |
|
0.498 0.438 | 0.544 |
0.007 0.000 | 0.077 |
0.227 0.133 | 0.261 |
0.000 0.000 | 0.000 |
0.000 0.000 | 0.000 |
0.028 0.000 | 0.100 |
0.240 0.215 | 0.258 |
0.000 0.000 | 0.000 |
| 1 spectrum, EIYGLVETFNFRPNEFK | 0.704 | 0.000 | 0.093 | 0.000 | 0.000 | 0.000 | 0.203 | 0.000 | ||
| 3 spectra, SDPAAFESR | 0.381 | 0.050 | 0.319 | 0.000 | 0.000 | 0.072 | 0.177 | 0.000 | ||
| 1 spectrum, QIWQQYFSAK | 0.221 | 0.000 | 0.064 | 0.000 | 0.000 | 0.493 | 0.222 | 0.000 | ||
| 1 spectrum, FDVIWNR | 0.618 | 0.000 | 0.077 | 0.000 | 0.000 | 0.000 | 0.305 | 0.000 |
| Plot | Lyso | Other | |||||||||||
| Expt C |
6 peptides |
14 spectra |
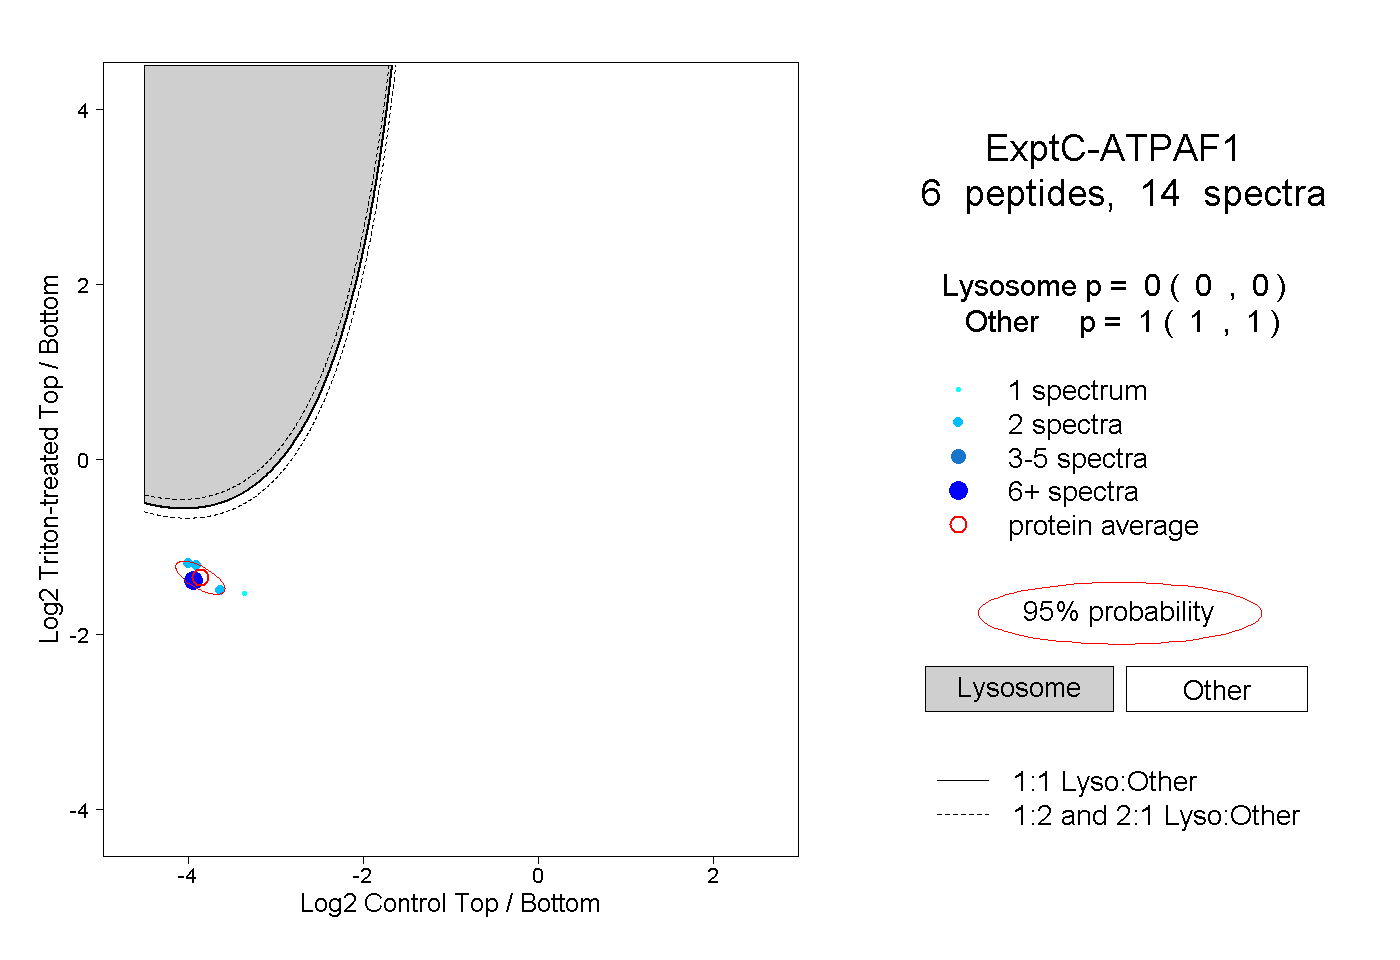 |
0.000 0.000 | 0.000 |
1.000 1.000 | 1.000 |
||||||||
| Plot | Lyso | Other | |||||||||||
| Expt D |
1 peptide |
1 spectrum |
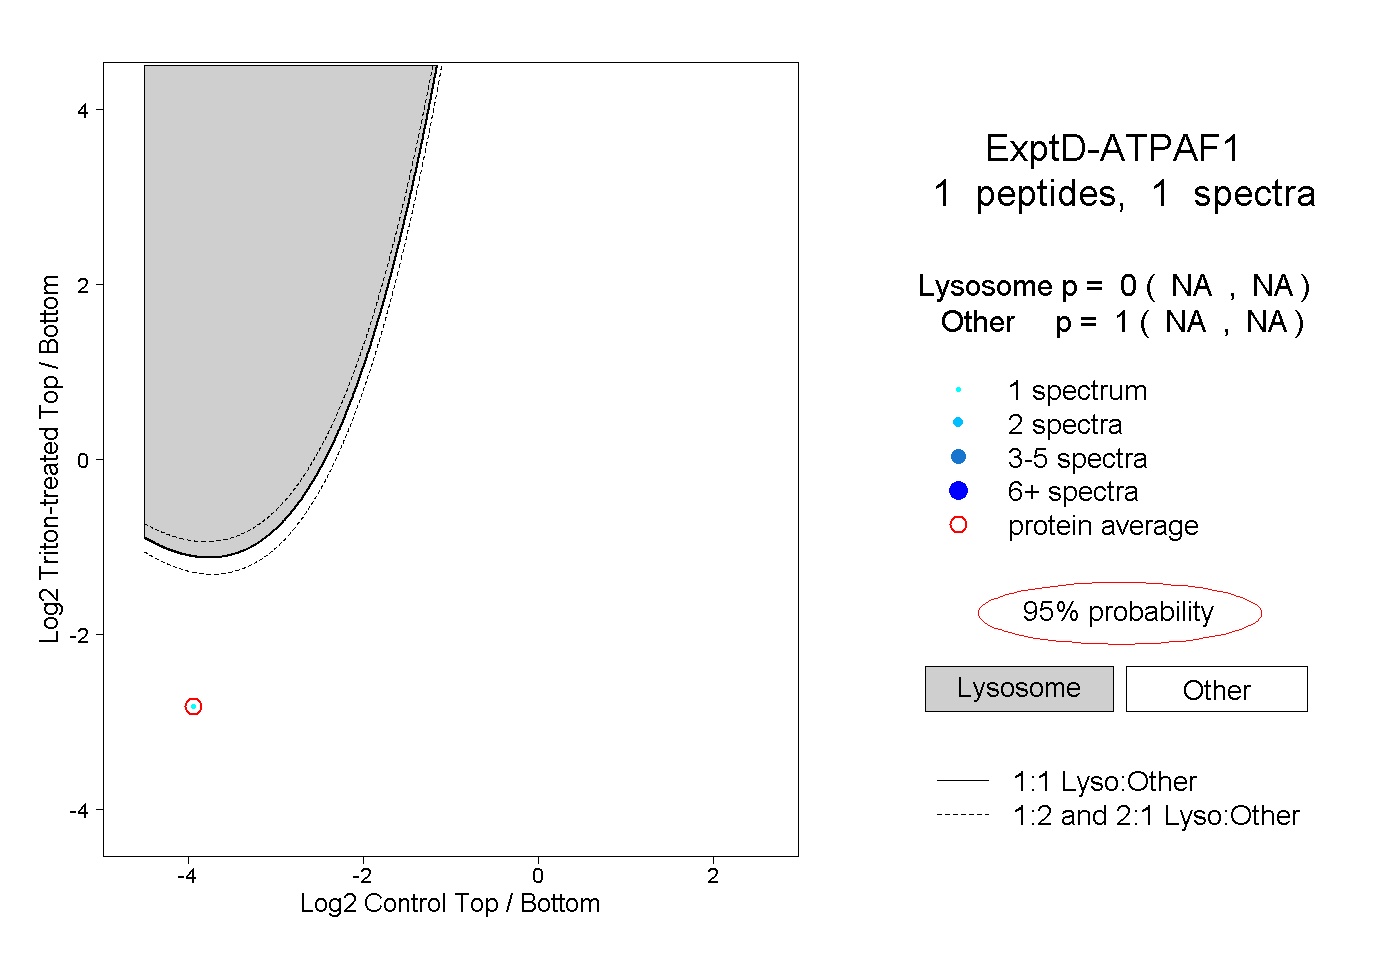 |
0.000 NA | NA |
1.000 NA | NA |