 13
13peptides
spectra
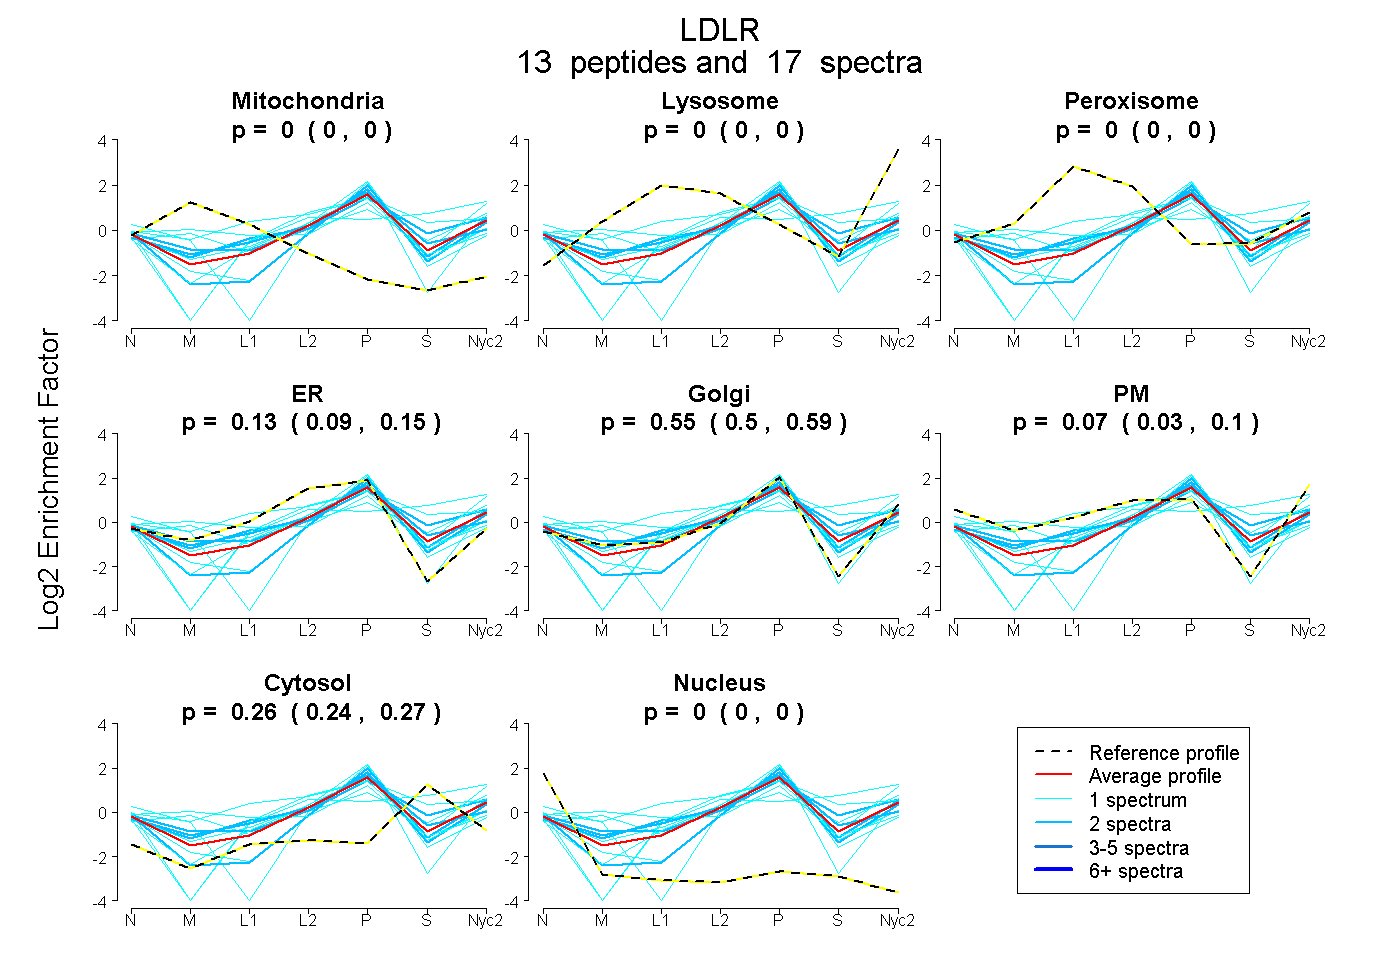
0.000 | 0.000
0.000 | 0.000
0.000 | 0.000
0.094 | 0.153
0.501 | 0.592
0.033 | 0.100
0.238 | 0.268
0.000 | 0.000
2peptides
spectra
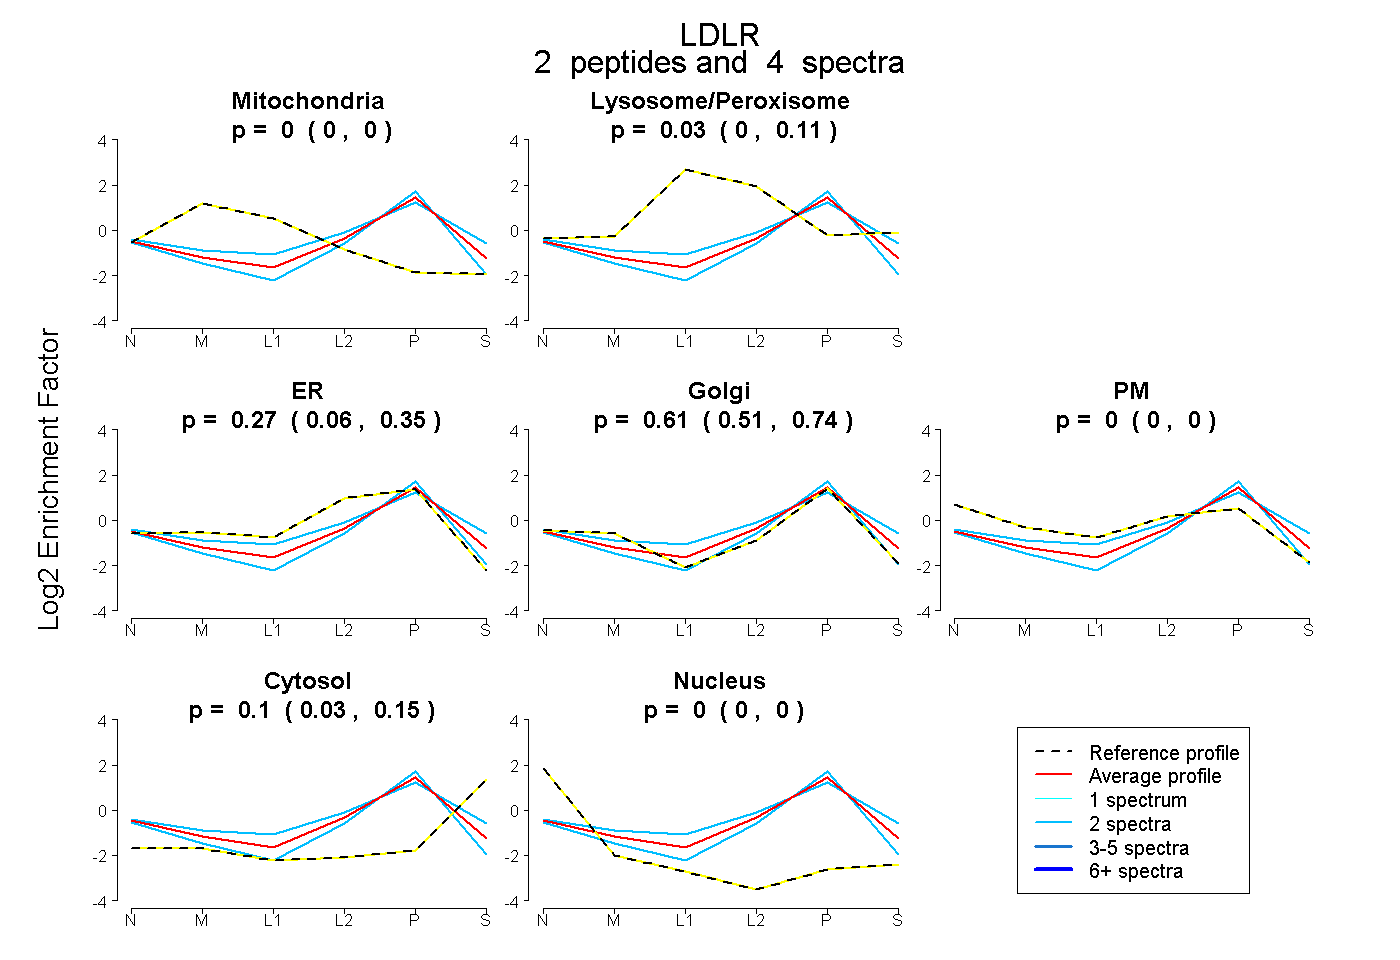
0.000 | 0.000
0.000 | 0.113
0.061 | 0.346
0.508 | 0.736
0.000 | 0.000
0.035 | 0.146
0.000 | 0.000
9peptides
spectra
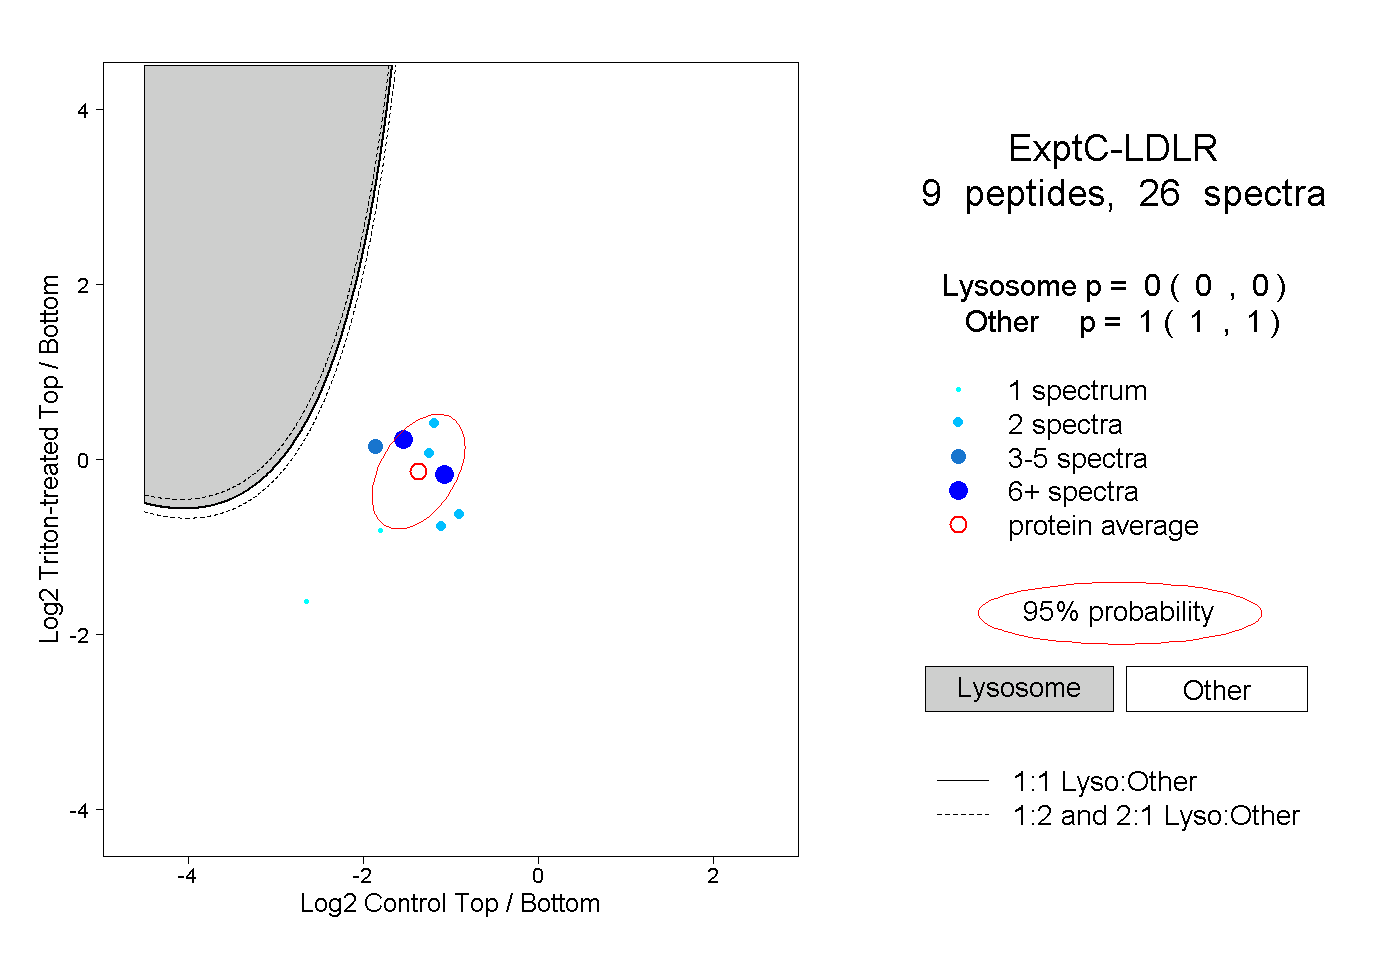
0.000 | 0.000
1.000 | 1.000
3peptides
spectra

0.000 | 0.000
1.000 | 1.000