 13
13peptides
spectra
0.000 | 0.000
0.000 | 0.000
0.000 | 0.000
0.094 | 0.153
0.501 | 0.592
0.033 | 0.100
0.238 | 0.268
0.000 | 0.000
| Plot | Mito | Lyso | Perox | ER | Golgi | PM | Cytosol | Nucleus | |||||
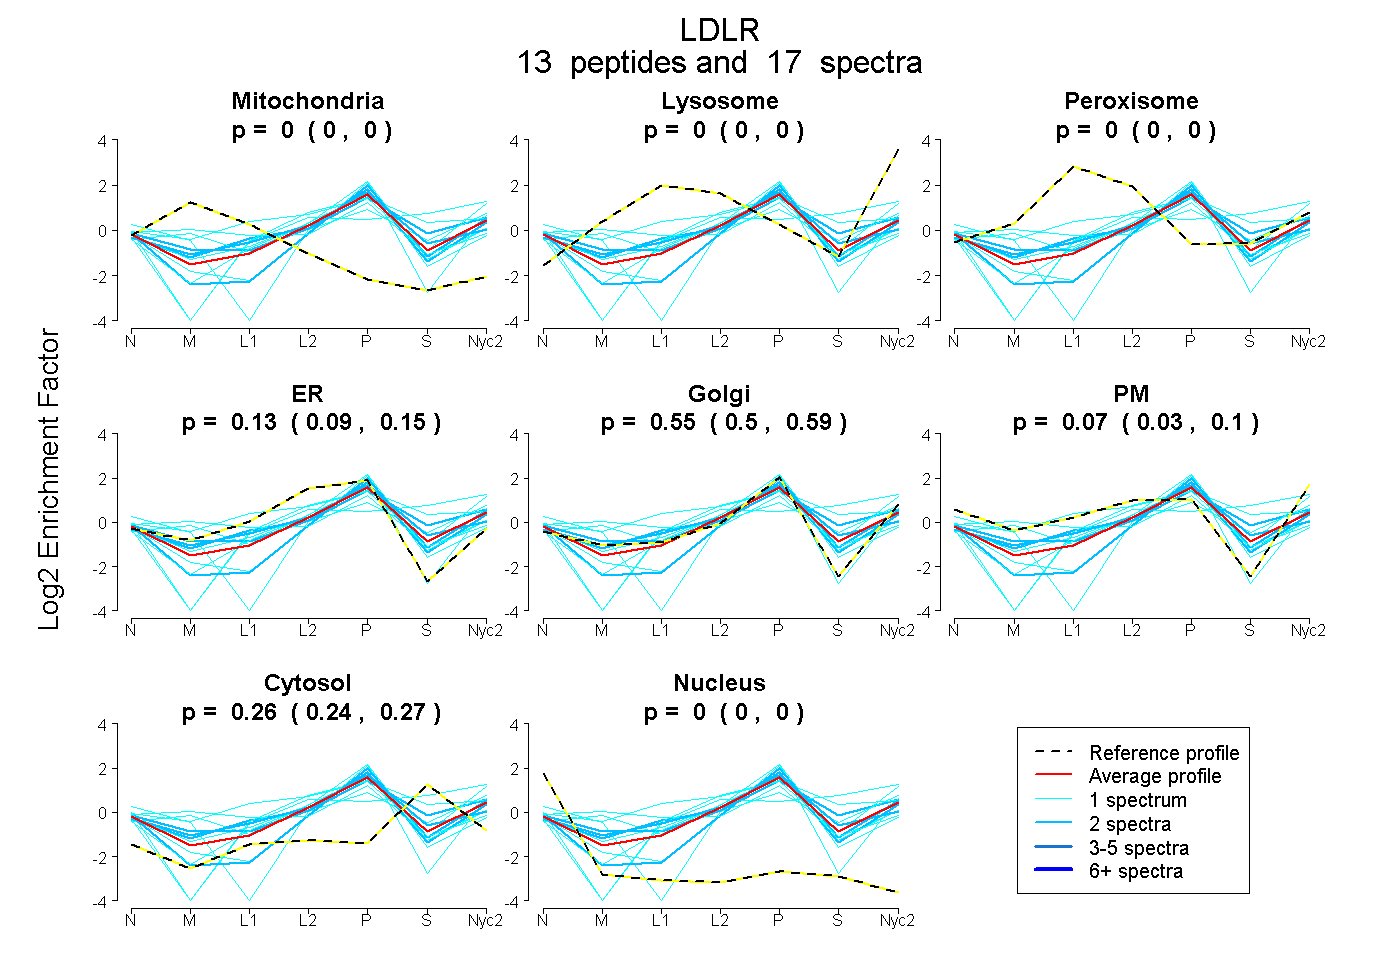
| Expt A |
13 peptides |
17 spectra |
|
0.000 0.000 | 0.000 |
0.000 0.000 | 0.000 |
0.000 0.000 | 0.000 |
0.126 0.094 | 0.153 |
0.548 0.501 | 0.592 |
0.070 0.033 | 0.100 |
0.255 0.238 | 0.268 |
0.000 0.000 | 0.000 |
| 2 spectra, LYWVDSK | 0.000 | 0.000 | 0.008 | 0.141 | 0.653 | 0.049 | 0.149 | 0.000 | ||
| 1 spectrum, LTGSDVNLVAK | 0.000 | 0.018 | 0.000 | 0.332 | 0.159 | 0.000 | 0.491 | 0.000 | ||
| 1 spectrum, LHSISSIDVNGGGR | 0.000 | 0.000 | 0.000 | 0.000 | 0.647 | 0.000 | 0.297 | 0.057 | ||
| 1 spectrum, FTCACPDGMLLAK | 0.036 | 0.000 | 0.060 | 0.213 | 0.543 | 0.000 | 0.149 | 0.000 | ||
| 1 spectrum, TNECLDNNGGCSHICK | 0.000 | 0.000 | 0.000 | 0.247 | 0.550 | 0.000 | 0.203 | 0.000 | ||
| 1 spectrum, SEYTSLIPNLK | 0.000 | 0.045 | 0.000 | 0.000 | 0.000 | 0.357 | 0.598 | 0.000 | ||
| 1 spectrum, TILEDEK | 0.150 | 0.000 | 0.161 | 0.000 | 0.588 | 0.000 | 0.101 | 0.000 | ||
| 2 spectra, WVCDGSR | 0.000 | 0.000 | 0.072 | 0.234 | 0.443 | 0.000 | 0.251 | 0.000 | ||
| 2 spectra, DWSDEPLK | 0.000 | 0.035 | 0.150 | 0.000 | 0.541 | 0.000 | 0.274 | 0.000 | ||
| 1 spectrum, IGYECLCPSGFR | 0.000 | 0.000 | 0.000 | 0.000 | 0.796 | 0.000 | 0.115 | 0.089 | ||
| 1 spectrum, NVVALDTEVANNR | 0.000 | 0.086 | 0.253 | 0.000 | 0.447 | 0.154 | 0.060 | 0.000 | ||
| 2 spectra, SWVCDGAADCK | 0.000 | 0.000 | 0.000 | 0.000 | 0.758 | 0.000 | 0.230 | 0.012 | ||
| 1 spectrum, GDEVQR | 0.000 | 0.000 | 0.000 | 0.210 | 0.789 | 0.000 | 0.000 | 0.001 |
| Plot | Mito | Lyso or Perox | ER | Golgi | PM | Cytosol | Nucleus | ||||||
| Expt B |
2 peptides |
4 spectra |
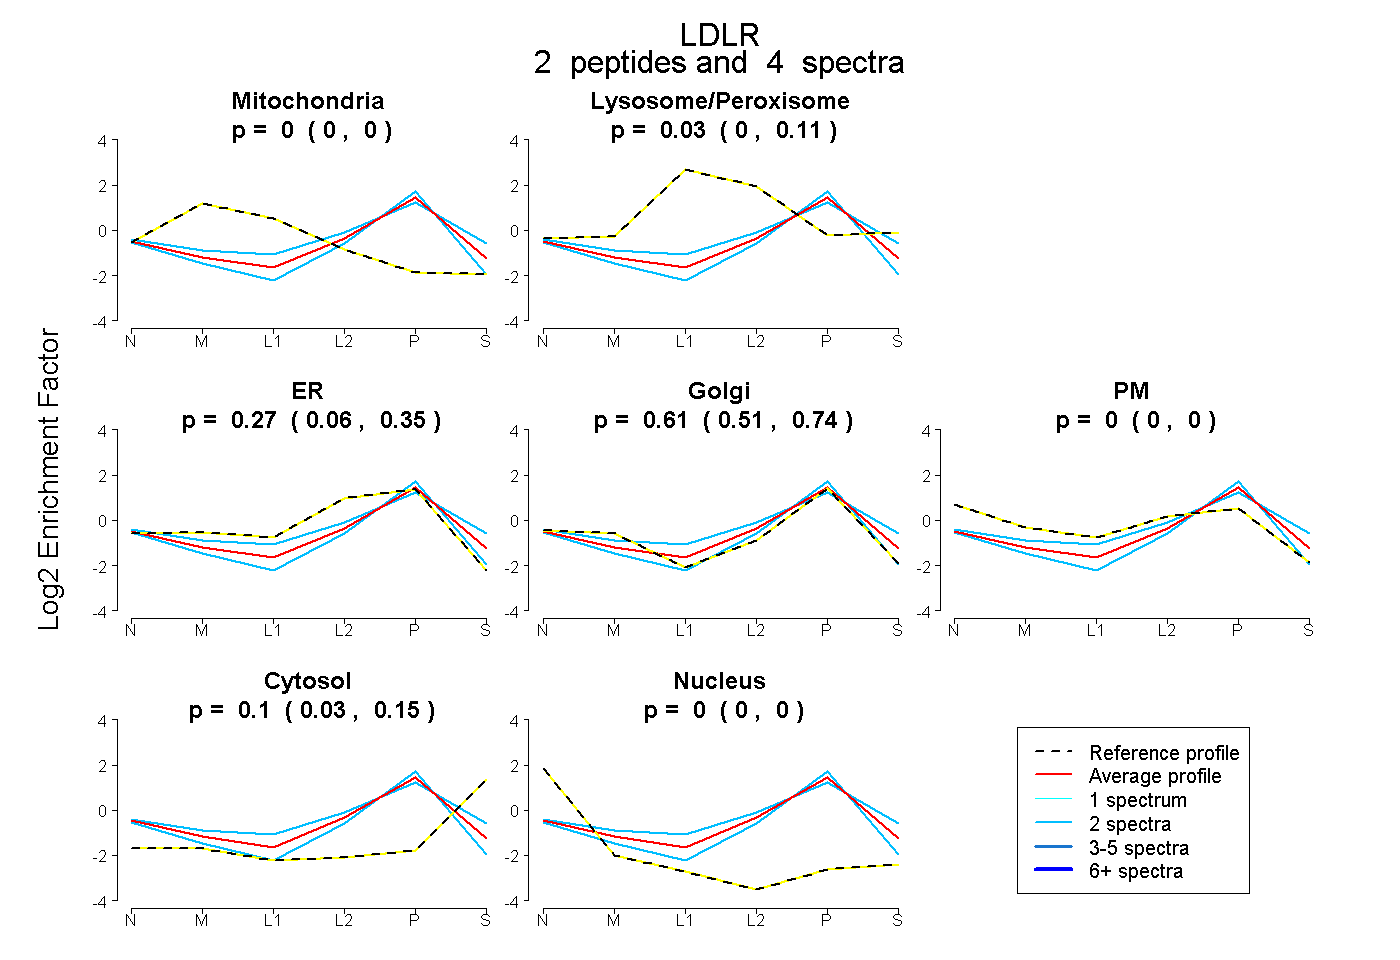 |
0.000 0.000 | 0.000 |
0.025 0.000 | 0.113 |
0.267 0.061 | 0.346 |
0.605 0.508 | 0.736 |
0.000 0.000 | 0.000 |
0.103 0.035 | 0.146 |
0.000 0.000 | 0.000 |
|||
| Plot | Lyso | Other | |||||||||||
| Expt C |
9 peptides |
26 spectra |
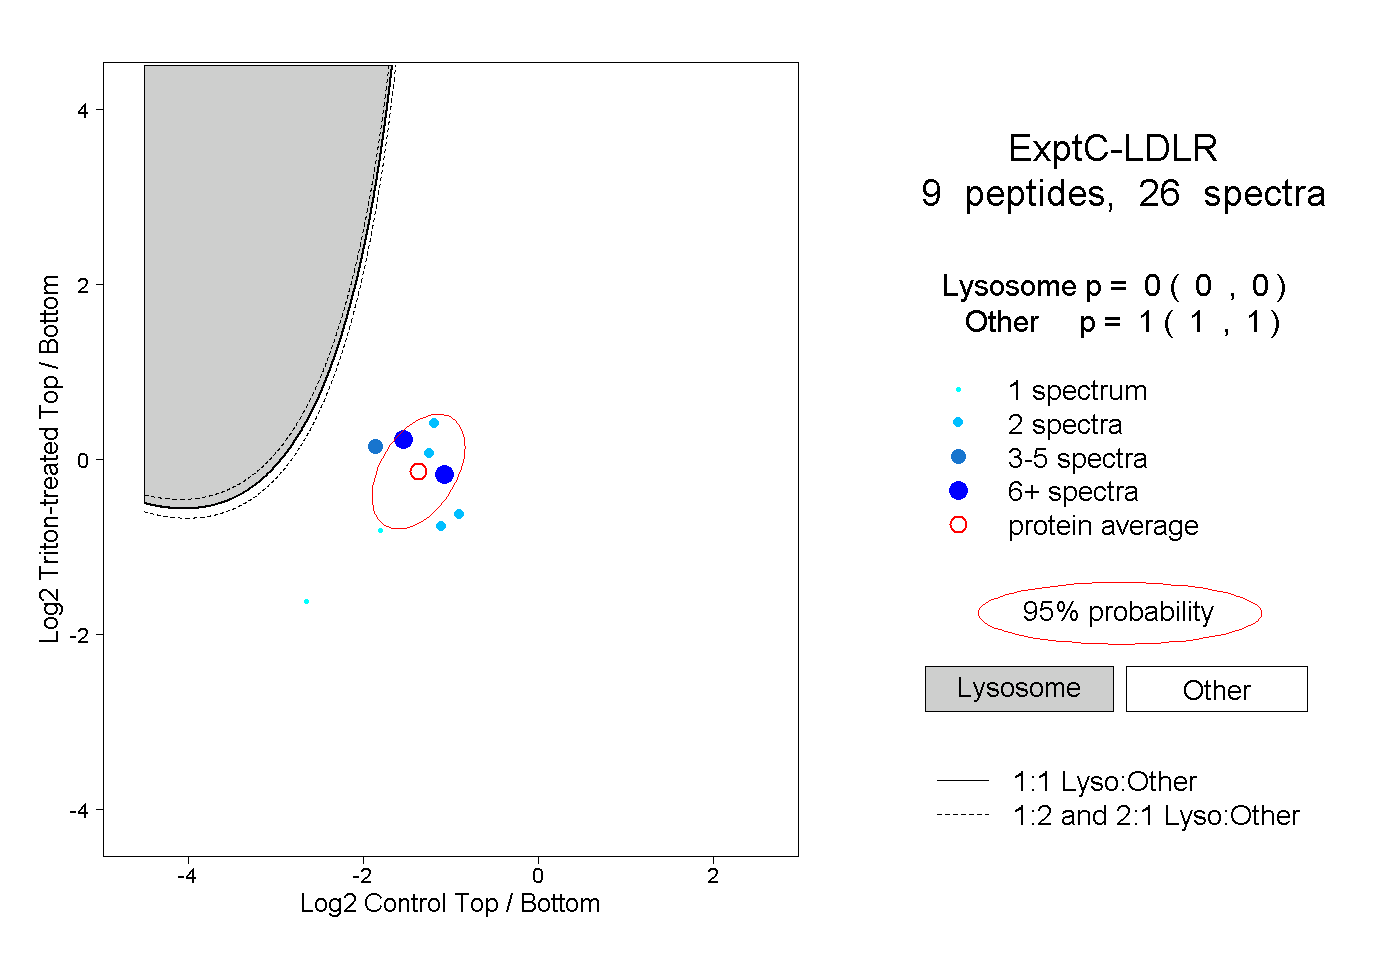 |
0.000 0.000 | 0.000 |
1.000 1.000 | 1.000 |
||||||||
| Plot | Lyso | Other | |||||||||||
| Expt D |
3 peptides |
3 spectra |
 |
0.000 0.000 | 0.000 |
1.000 1.000 | 1.000 |