 39
39peptides
spectra

0.000 | 0.000
0.561 | 0.565
0.000 | 0.000
0.000 | 0.000
0.062 | 0.065
0.000 | 0.000
0.372 | 0.375
0.000 | 0.000
21peptides
spectra
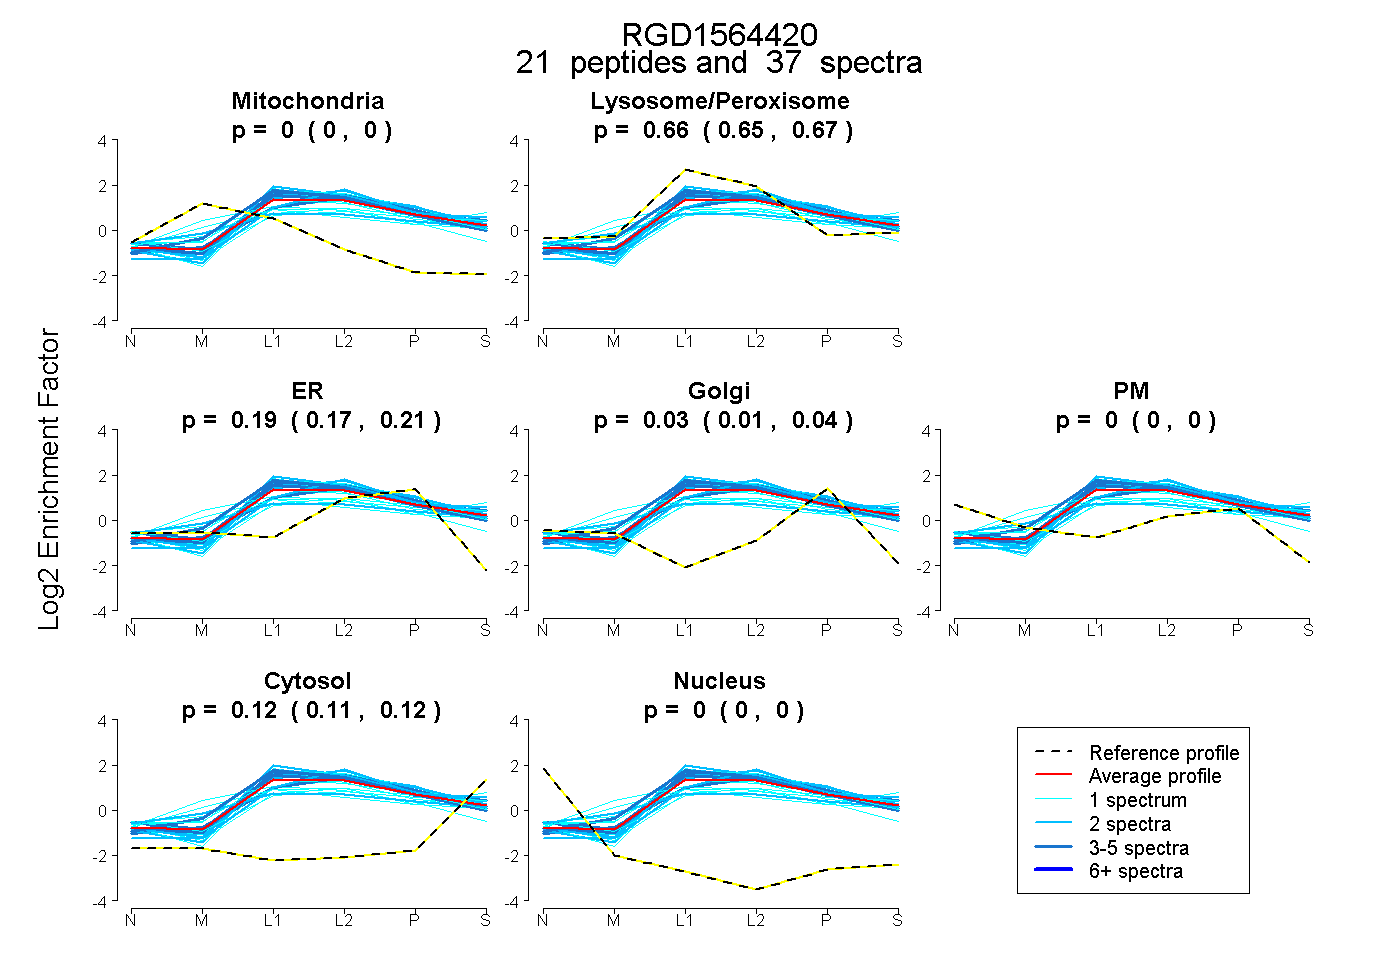
0.000 | 0.000
0.654 | 0.672
0.167 | 0.213
0.005 | 0.045
0.000 | 0.000
0.111 | 0.123
0.000 | 0.000
50peptides
spectra

0.959 | 1.000
0.000 | 0.040
13peptides
spectra
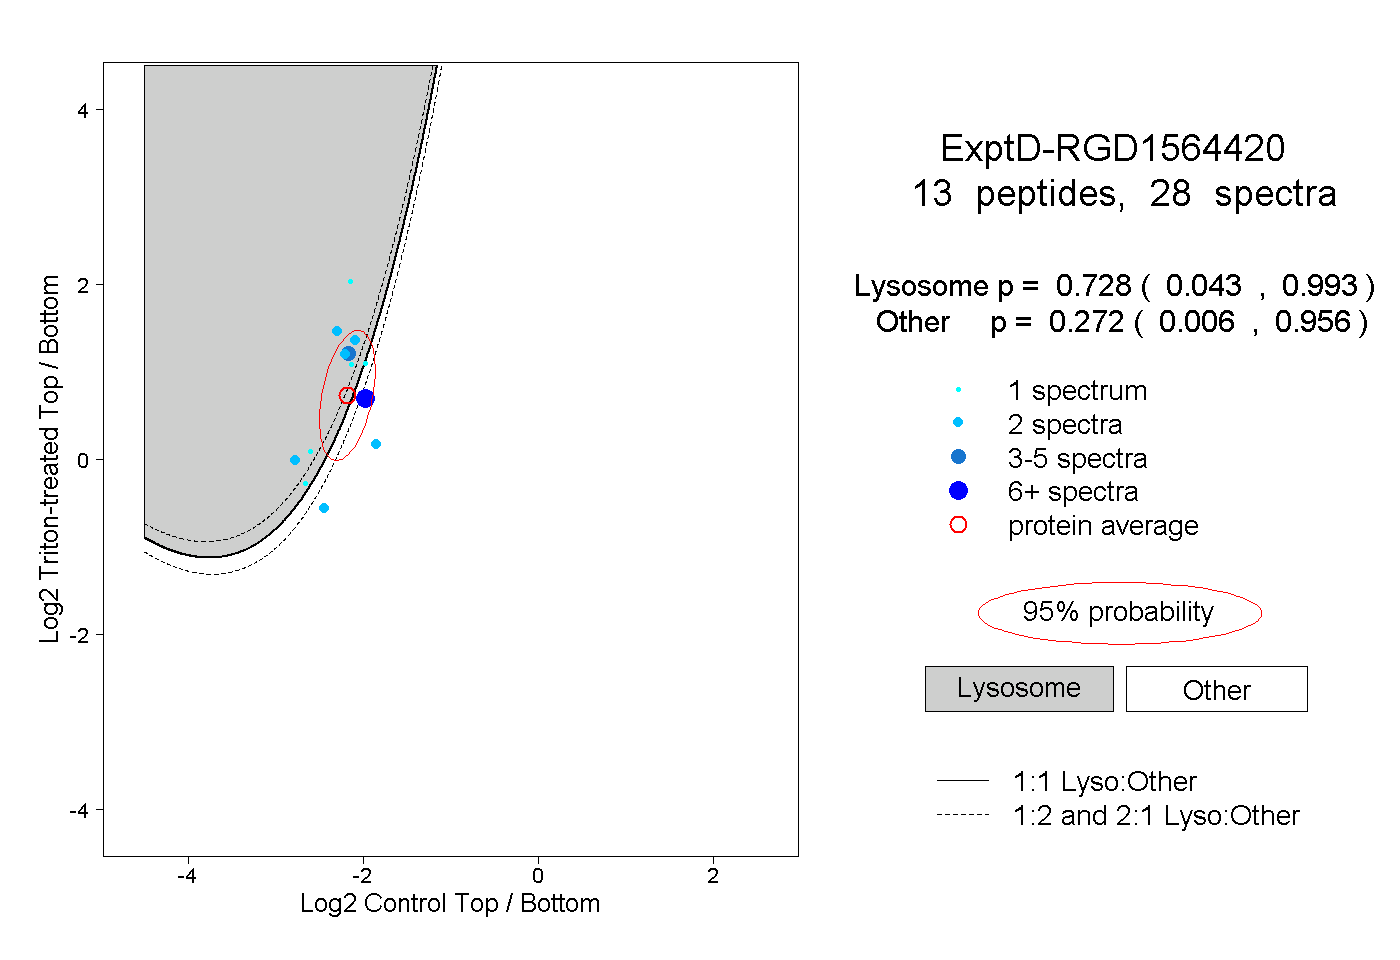
0.043 | 0.993
0.006 | 0.956