RGD1564420
[ENSRNOP00000013315]
Main page
| | | Plot |
Mito |
Lyso |
|
Perox |
ER |
Golgi |
PM |
Cytosol |
Nucleus |
|
| Expt A |
 39
39
peptides |
113
spectra |
 |
0.000
0.000 | 0.000 |
0.563
0.561 | 0.565 |
|
0.000
0.000 | 0.000 |
0.000
0.000 | 0.000 |
0.064
0.062 | 0.065 |
0.000
0.000 | 0.000 |
0.373
0.372 | 0.375 |
0.000
0.000 | 0.000 |
|
| | | Plot |
Mito |
|
Lyso or Perox |
|
ER |
Golgi |
PM |
Cytosol |
Nucleus |
|
| Expt B |
21
peptides |
37
spectra |
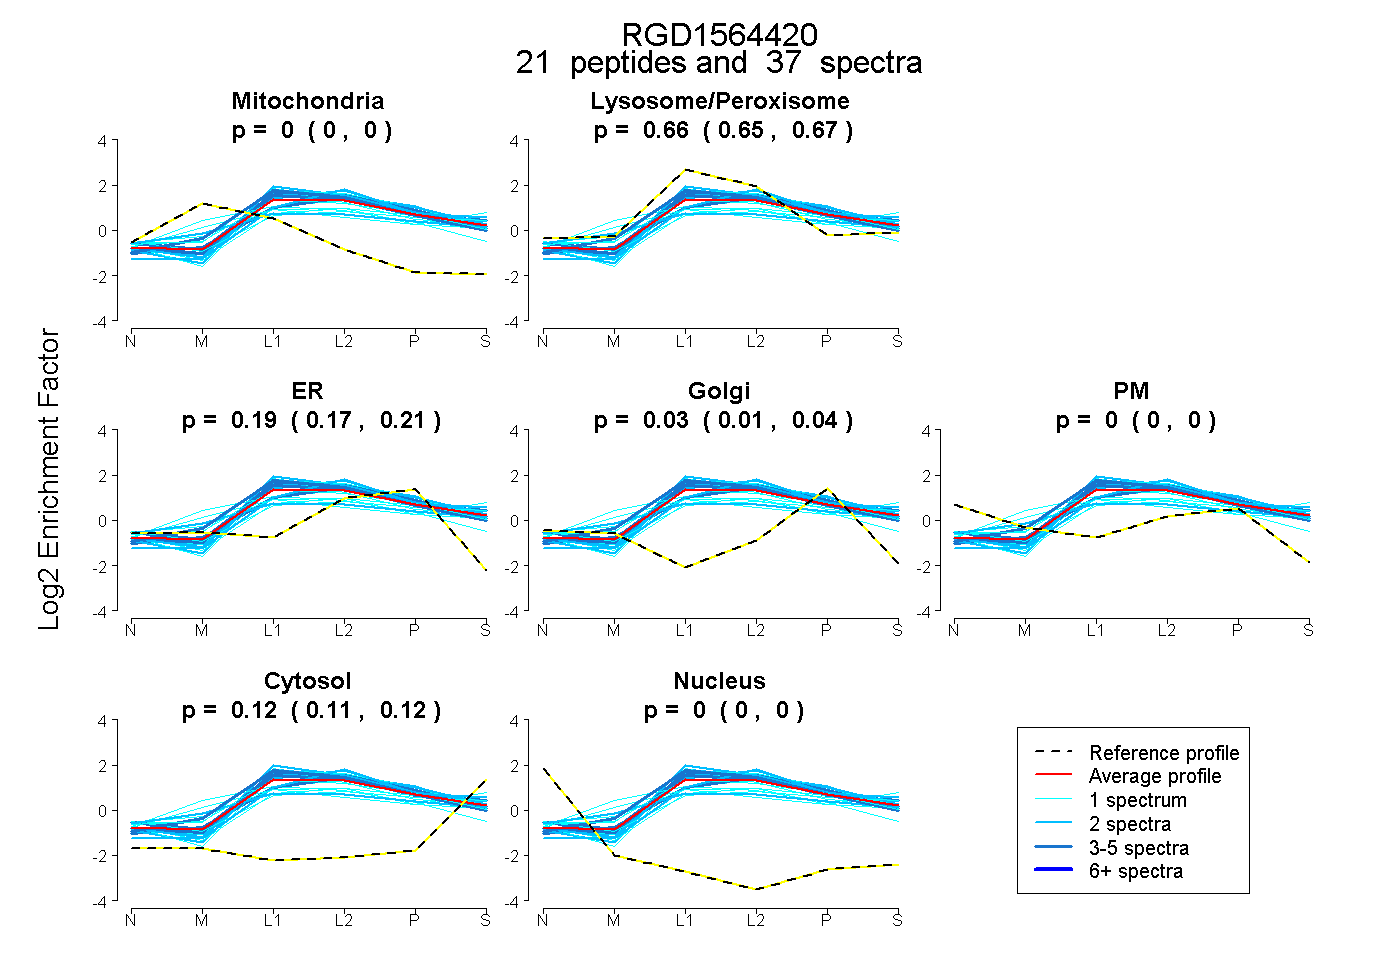 |
0.000
0.000 | 0.000 |
|
0.664
0.654 | 0.672 |
|
0.191
0.167 | 0.213 |
0.027
0.005 | 0.045 |
0.000
0.000 | 0.000 |
0.117
0.111 | 0.123 |
0.000
0.000 | 0.000 |
|
| | | Plot |
|
Lyso |
|
|
|
|
|
|
|
Other |
| Expt C |
50
peptides |
284
spectra |
 |
|
0.999
0.959 | 1.000 |
|
|
|
|
|
|
|
0.001
0.000 | 0.040 |
| | | Plot |
|
Lyso |
|
|
|
|
|
|
|
Other |
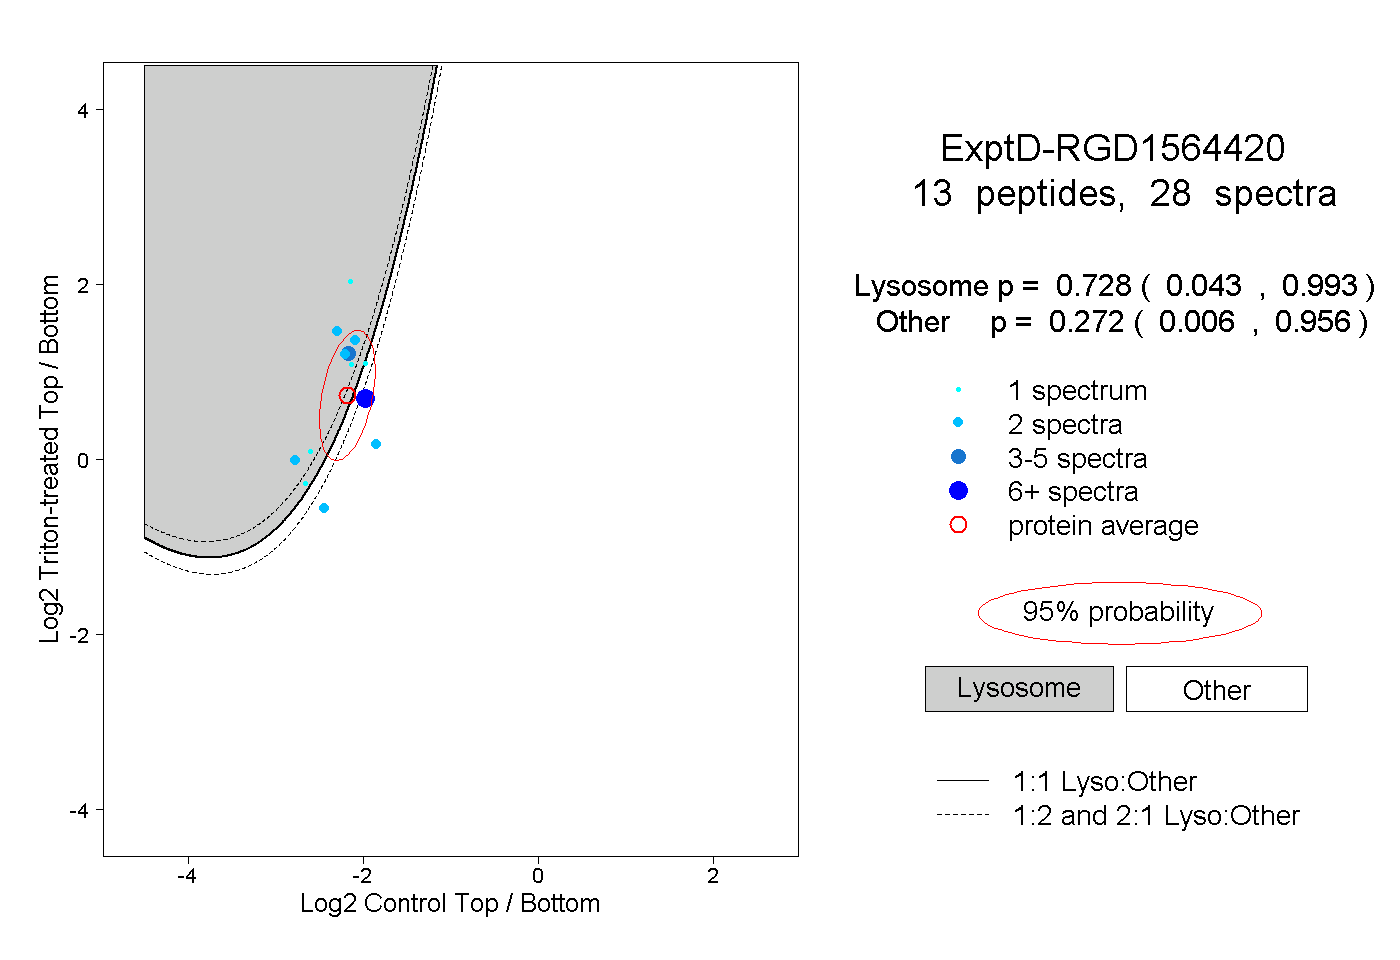
| Expt D |
13
peptides |
28
spectra |
 |
|
0.728
0.043 | 0.993 |
|
|
|
|
|
|
|
0.272
0.006 | 0.956 |
| 2 spectra, FLHQMIR |
|
0.001 |
|
|
|
|
|
|
|
0.999 |
| 1 spectrum, TVQETLK |
|
0.658 |
|
|
|
|
|
|
|
0.342 |
| 2 spectra, SIVANSSK |
|
0.983 |
|
|
|
|
|
|
|
0.017 |
| 2 spectra, MLVSYYR |
|
0.965 |
|
|
|
|
|
|
|
0.035 |
| 2 spectra, LASALDLPLLR |
|
0.958 |
|
|
|
|
|
|
|
0.042 |
| 1 spectrum, TTLVGIIK |
|
0.901 |
|
|
|
|
|
|
|
0.099 |
| 2 spectra, AQVQQFLK |
|
0.045 |
|
|
|
|
|
|
|
0.955 |
| 1 spectrum, AKPSELMPK |
|
0.911 |
|
|
|
|
|
|
|
0.089 |
| 8 spectra, VAFALHR |
|
0.088 |
|
|
|
|
|
|
|
0.912 |
| 3 spectra, DYAQLGPR |
|
0.971 |
|
|
|
|
|
|
|
0.029 |
| 1 spectrum, LEGEVR |
|
0.479 |
|
|
|
|
|
|
|
0.521 |
| 1 spectrum, EEVLLDNIPR |
|
1.000 |
|
|
|
|
|
|
|
0.000 |
| 2 spectra, YIVDLNR |
|
0.999 |
|
|
|
|
|
|
|
0.001 |