 6
6peptides
spectra
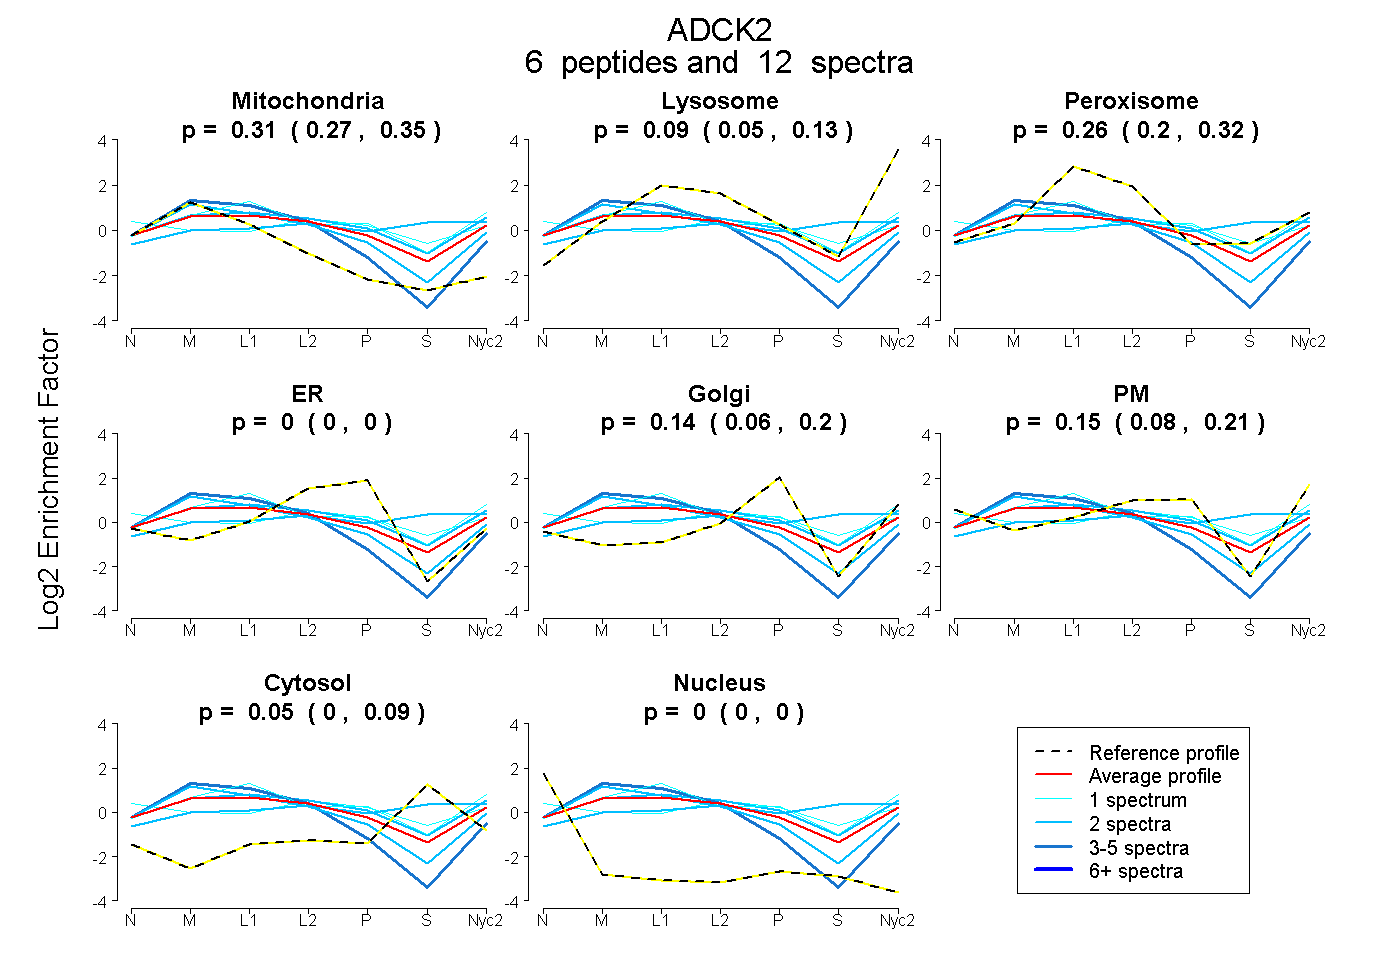
0.266 | 0.348
0.048 | 0.127
0.195 | 0.317
0.000 | 0.000
0.057 | 0.202
0.079 | 0.211
0.000 | 0.087
0.000 | 0.000
2peptides
spectra
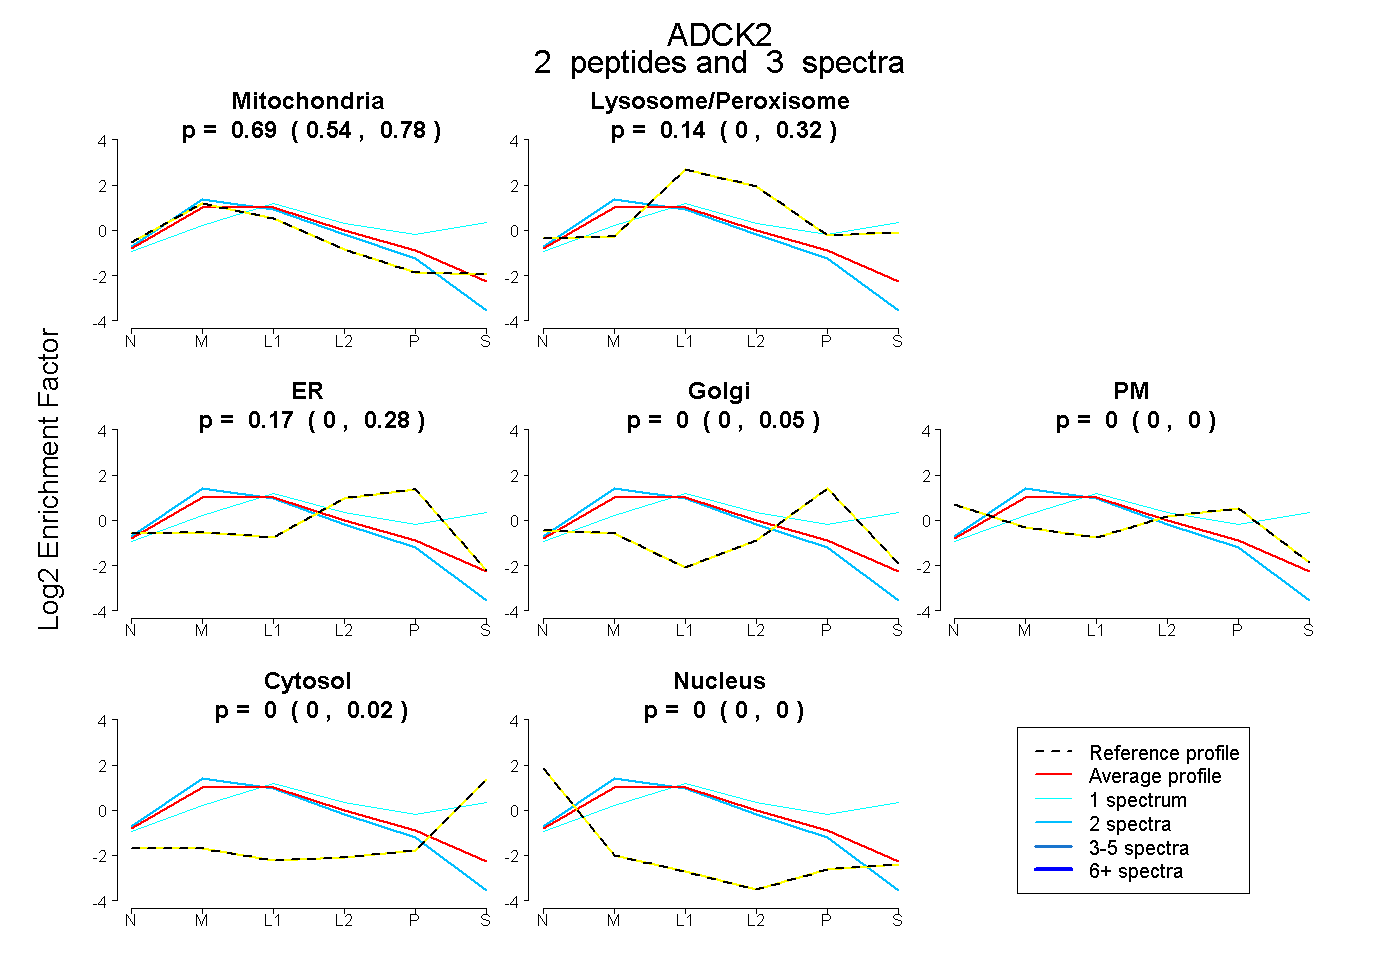
0.538 | 0.778
0.000 | 0.321
0.000 | 0.276
0.000 | 0.053
0.000 | 0.000
0.000 | 0.025
0.000 | 0.000
9peptides
spectra
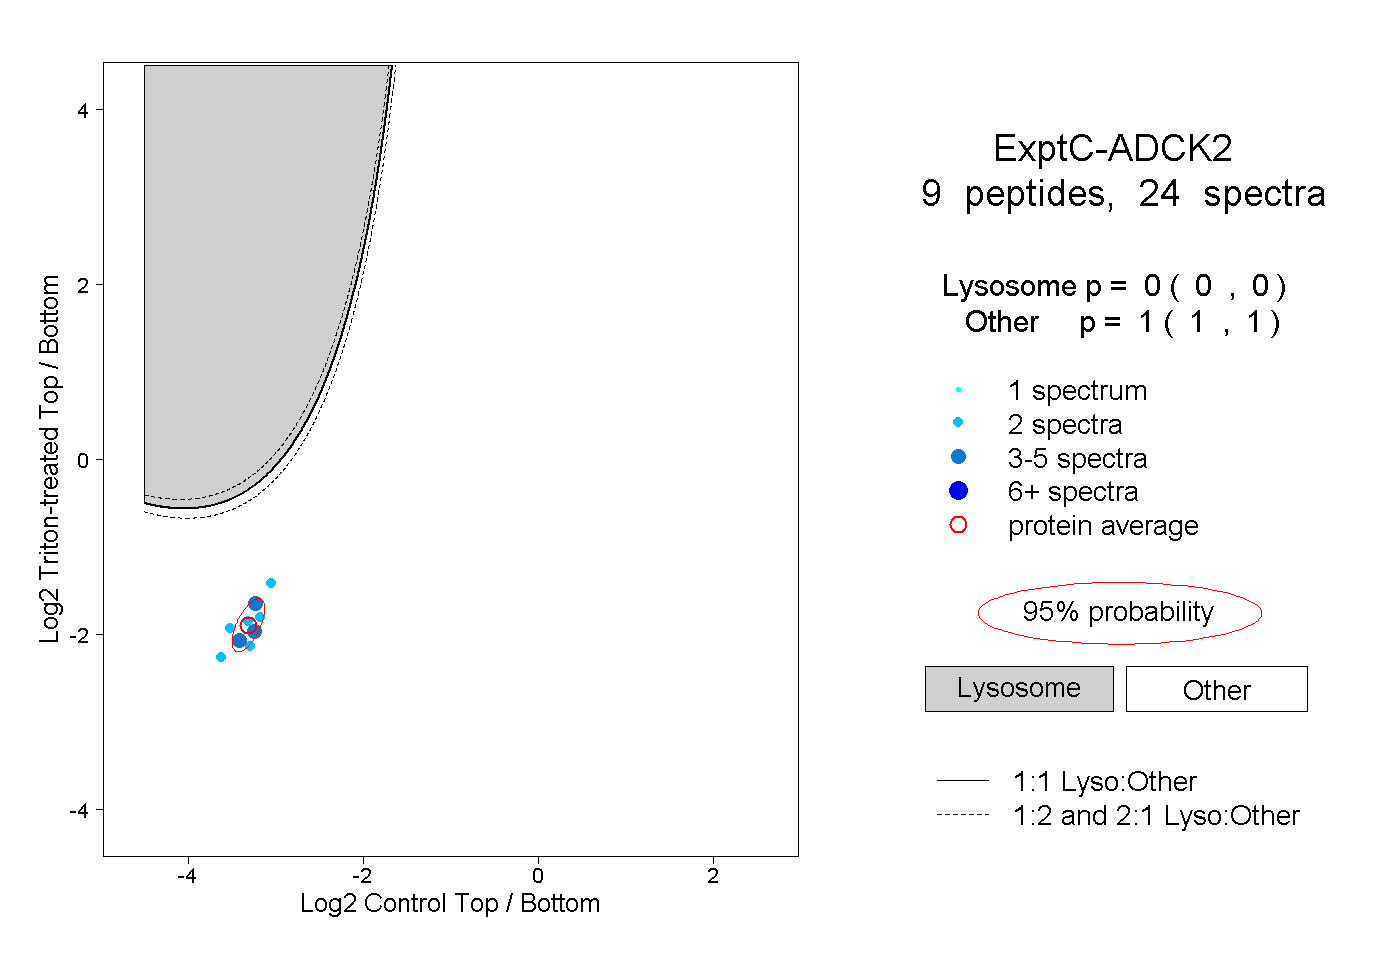
0.000 | 0.000
1.000 | 1.000
2peptides
spectra
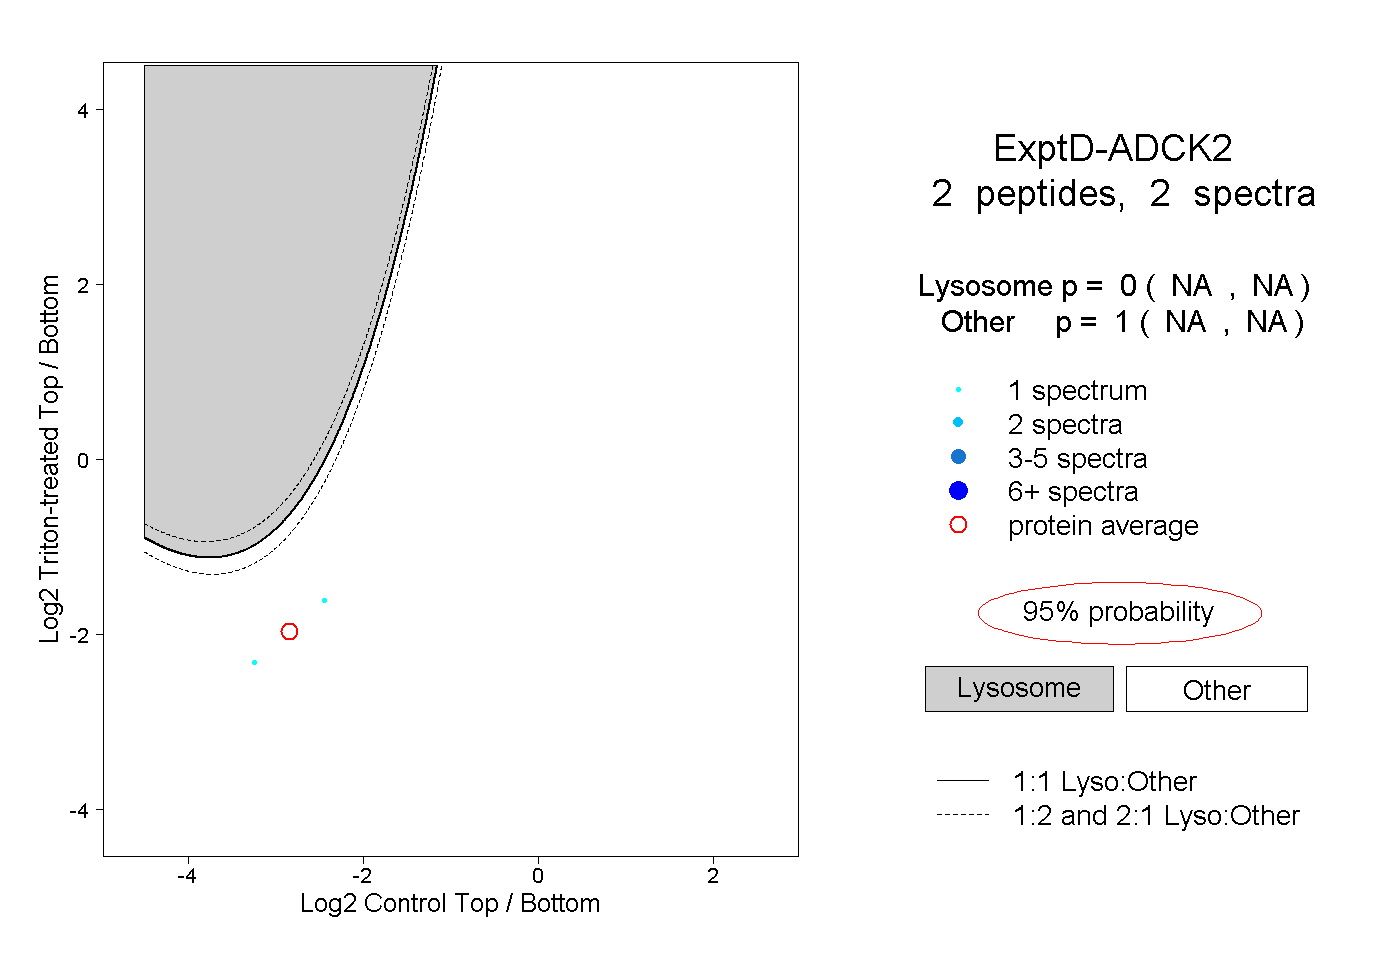
NA | NA
NA | NA