 6
6peptides
spectra
0.266 | 0.348
0.048 | 0.127
0.195 | 0.317
0.000 | 0.000
0.057 | 0.202
0.079 | 0.211
0.000 | 0.087
0.000 | 0.000
| Plot | Mito | Lyso | Perox | ER | Golgi | PM | Cytosol | Nucleus | |||||
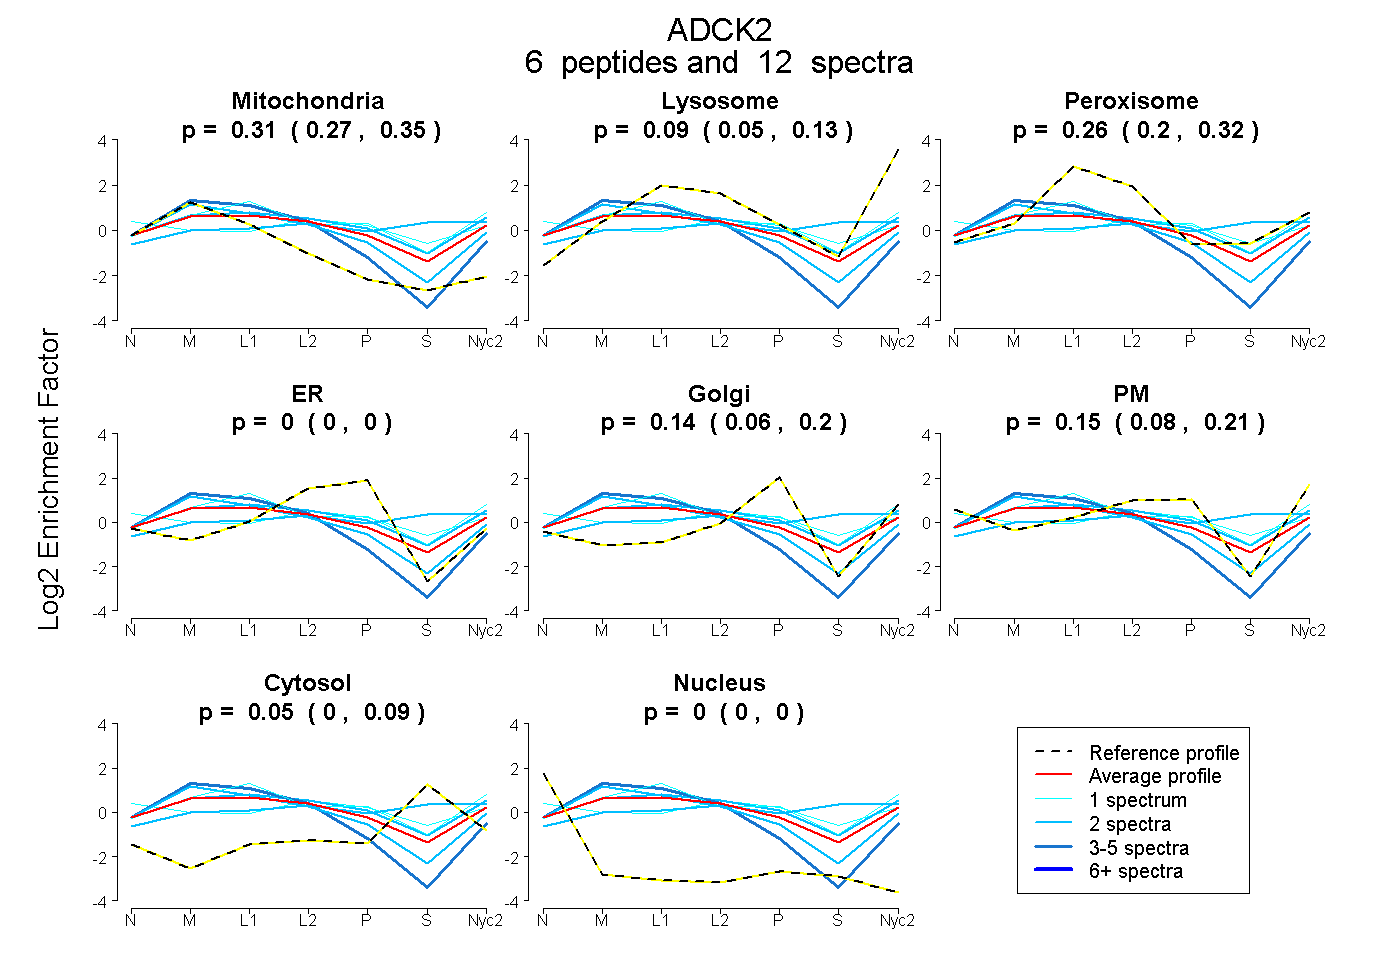
| Expt A |
6 peptides |
12 spectra |
|
0.311 0.266 | 0.348 |
0.091 0.048 | 0.127 |
0.261 0.195 | 0.317 |
0.000 0.000 | 0.000 |
0.139 0.057 | 0.202 |
0.150 0.079 | 0.211 |
0.047 0.000 | 0.087 |
0.000 0.000 | 0.000 |
| 4 spectra, FPTPLHPLITR | 0.635 | 0.152 | 0.040 | 0.049 | 0.000 | 0.124 | 0.000 | 0.000 | ||
| 1 spectrum, LMVQQTDLR | 0.188 | 0.171 | 0.376 | 0.000 | 0.255 | 0.000 | 0.009 | 0.000 | ||
| 2 spectra, LGQWASTR | 0.515 | 0.193 | 0.046 | 0.066 | 0.000 | 0.181 | 0.000 | 0.000 | ||
| 2 spectra, AVFLAVAMGQGHR | 0.205 | 0.104 | 0.329 | 0.000 | 0.162 | 0.146 | 0.054 | 0.000 | ||
| 1 spectrum, ATETSGPTYIK | 0.107 | 0.000 | 0.168 | 0.033 | 0.000 | 0.451 | 0.240 | 0.000 | ||
| 2 spectra, SEVGVSQAPGQPPK | 0.040 | 0.116 | 0.305 | 0.000 | 0.128 | 0.043 | 0.368 | 0.000 |
| Plot | Mito | Lyso or Perox | ER | Golgi | PM | Cytosol | Nucleus | ||||||
| Expt B |
2 peptides |
3 spectra |
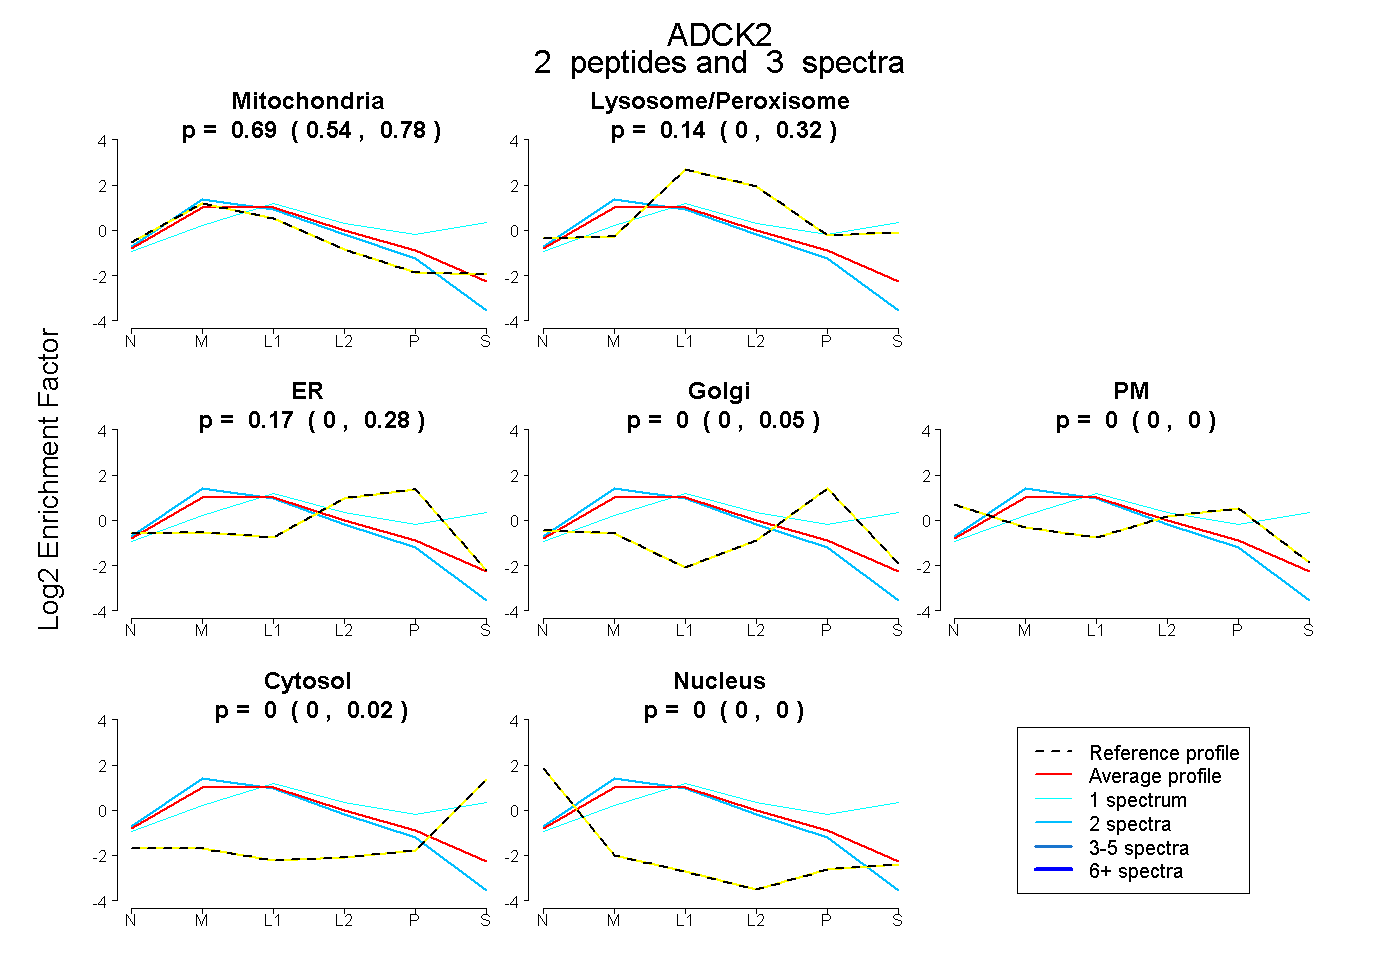 |
0.689 0.538 | 0.778 |
0.144 0.000 | 0.321 |
0.167 0.000 | 0.276 |
0.000 0.000 | 0.053 |
0.000 0.000 | 0.000 |
0.000 0.000 | 0.025 |
0.000 0.000 | 0.000 |
|||
| Plot | Lyso | Other | |||||||||||
| Expt C |
9 peptides |
24 spectra |
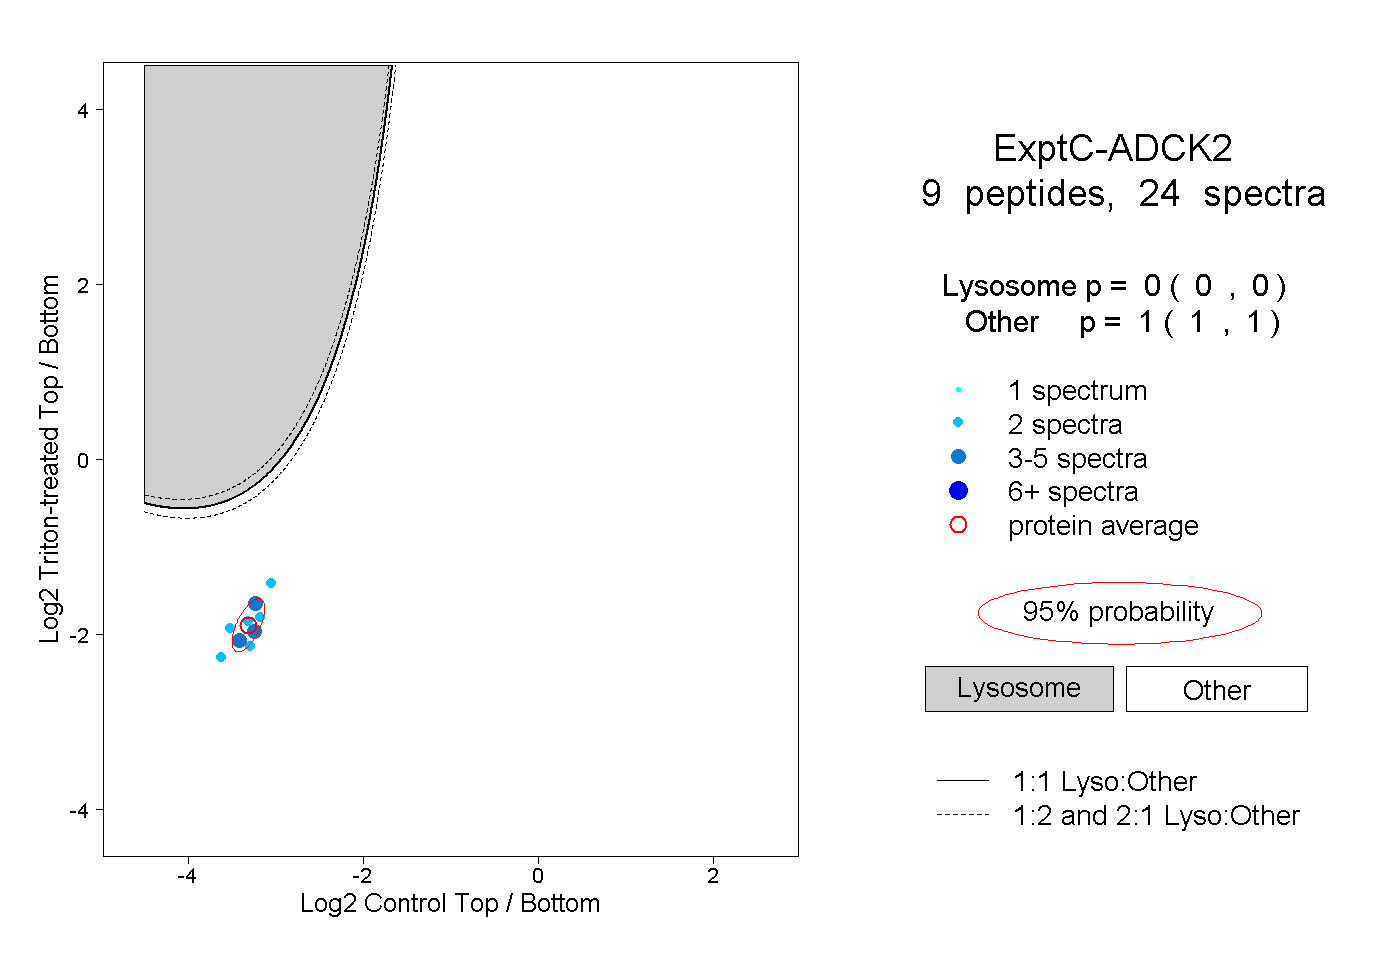 |
0.000 0.000 | 0.000 |
1.000 1.000 | 1.000 |
||||||||
| Plot | Lyso | Other | |||||||||||
| Expt D |
2 peptides |
2 spectra |
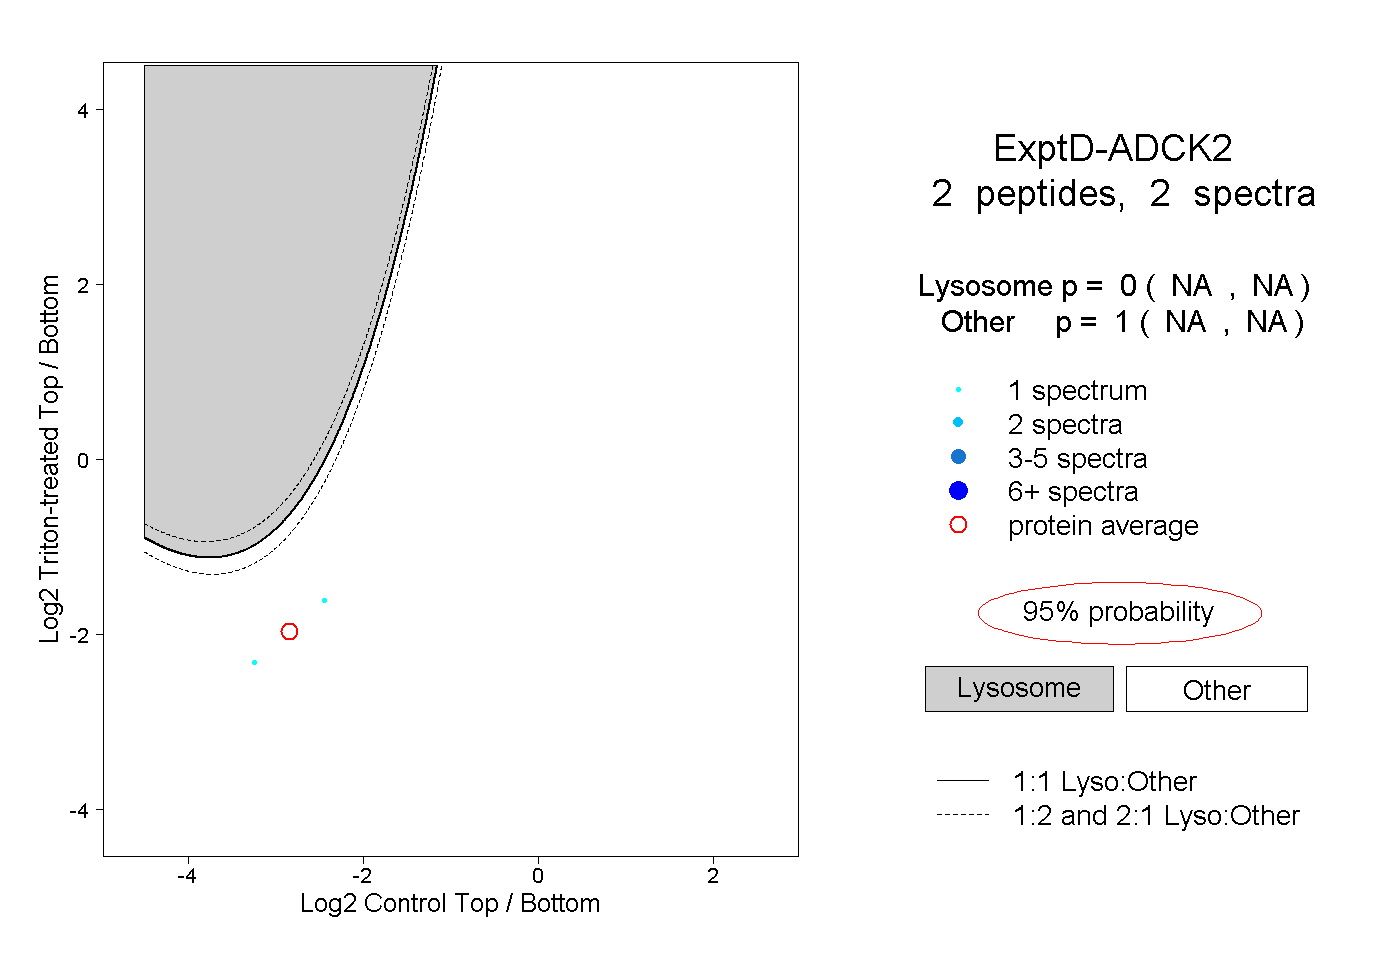 |
0.000 NA | NA |
1.000 NA | NA |