 10
10peptides
spectra
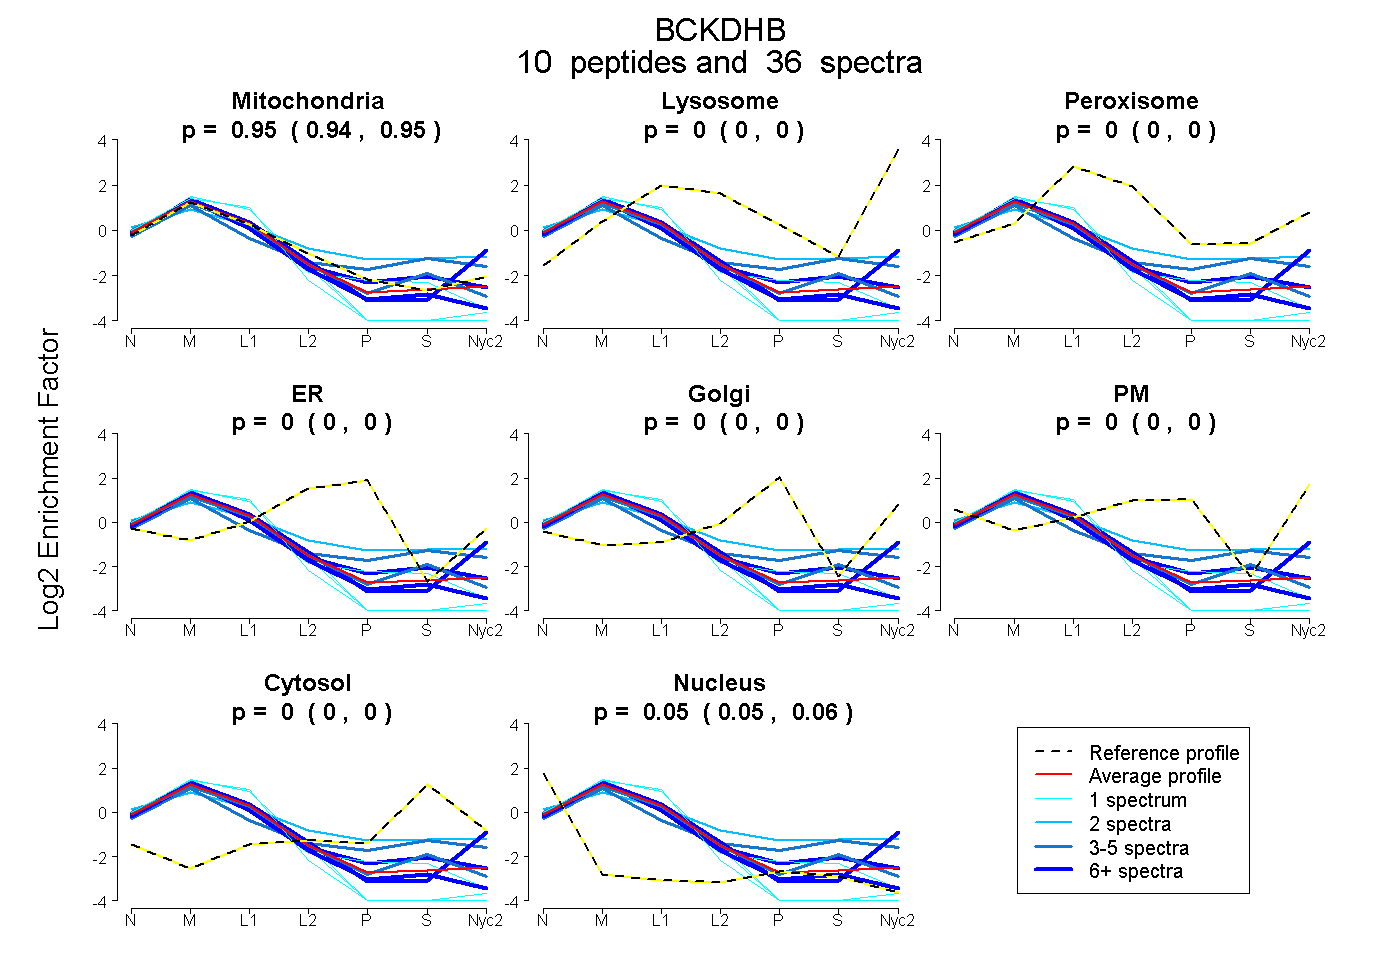
0.939 | 0.952
0.000 | 0.000
0.000 | 0.000
0.000 | 0.000
0.000 | 0.000
0.000 | 0.000
0.000 | 0.000
0.047 | 0.060
8peptides
spectra
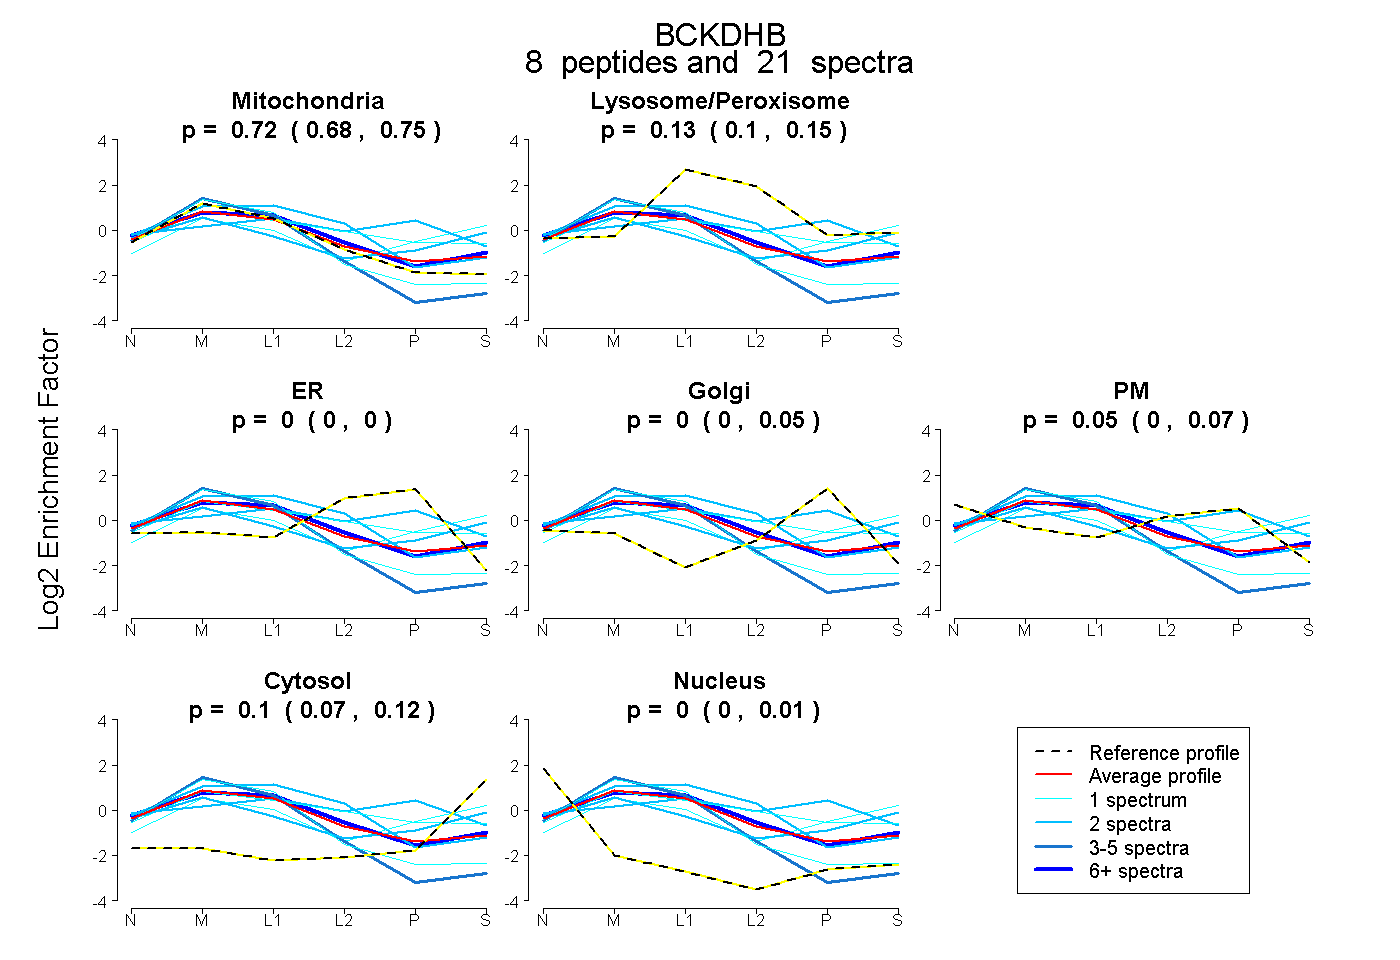
0.676 | 0.753
0.103 | 0.150
0.000 | 0.000
0.000 | 0.047
0.001 | 0.073
0.072 | 0.124
0.000 | 0.005
13peptides
spectra
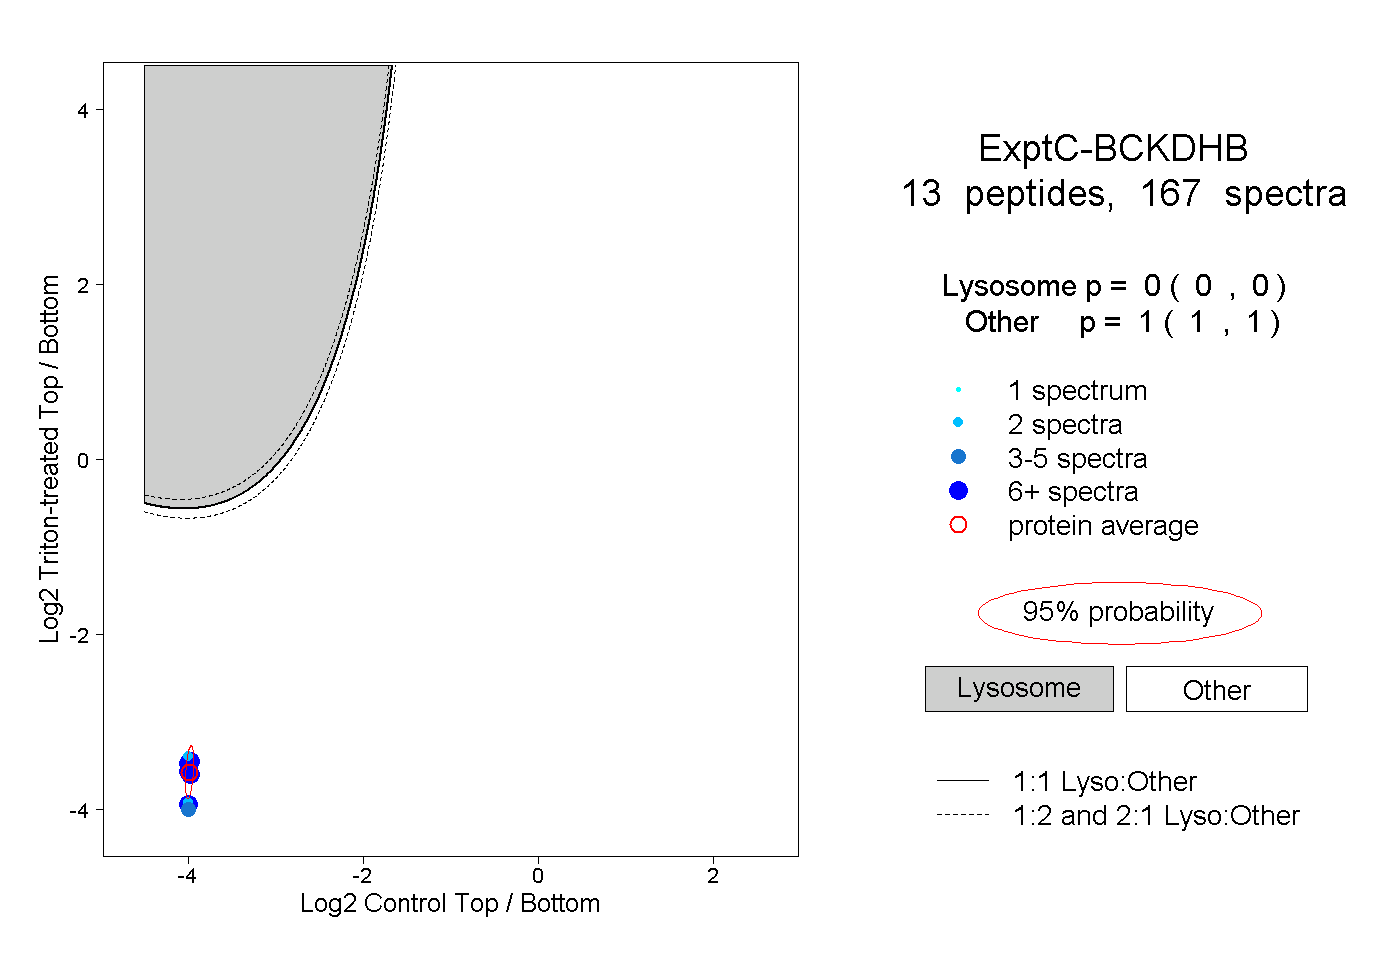
0.000 | 0.000
1.000 | 1.000
6peptides
spectra
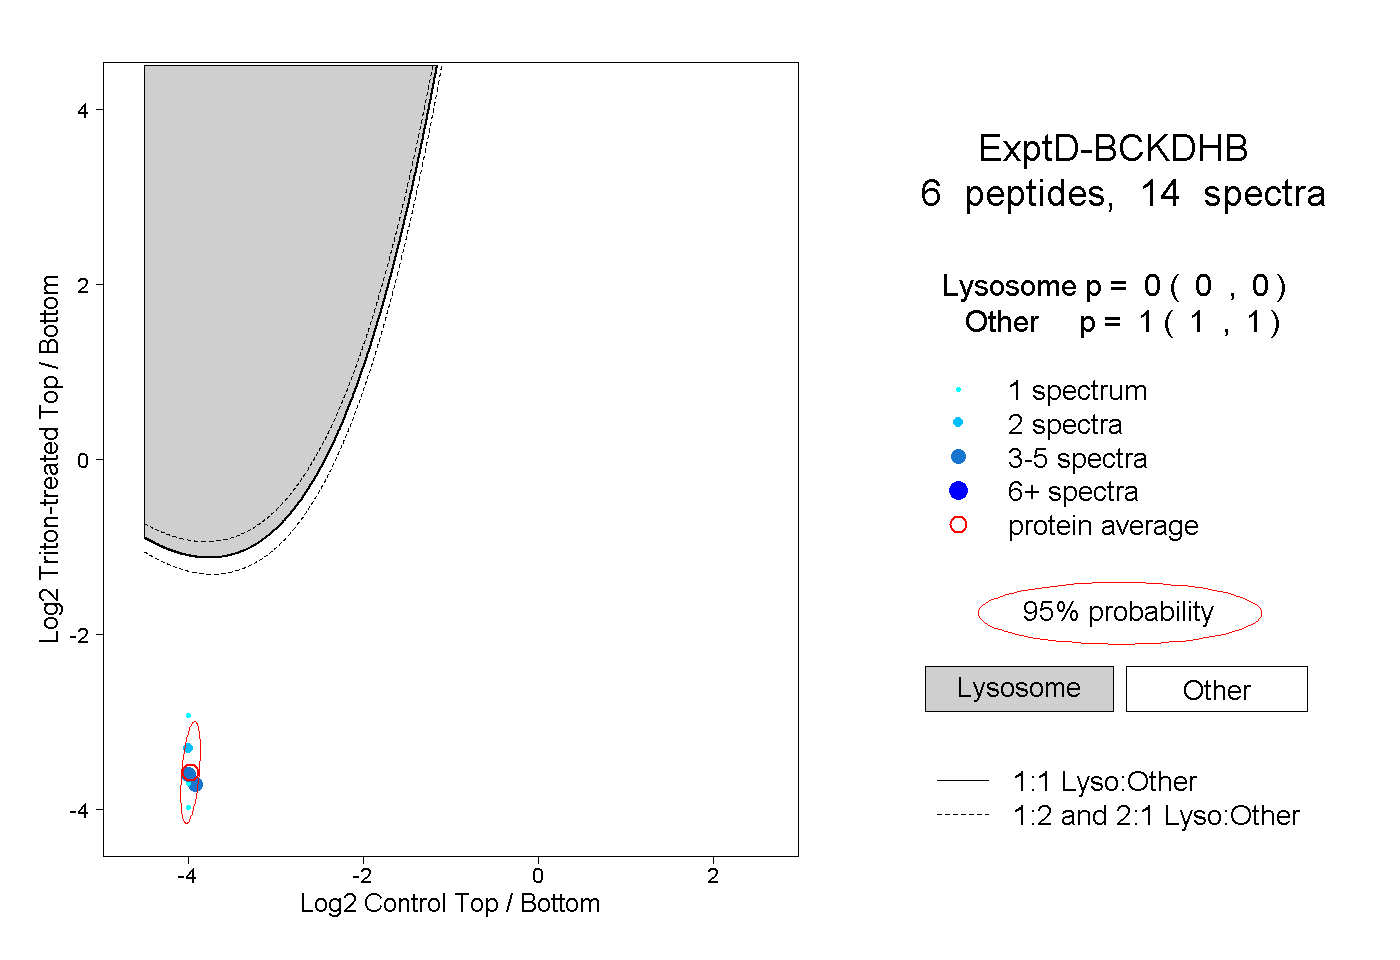
0.000 | 0.000
1.000 | 1.000