BCKDHB
[ENSRNOP00000013249]
Main page
| | | Plot |
Mito |
Lyso |
|
Perox |
ER |
Golgi |
PM |
Cytosol |
Nucleus |
|
| Expt A |
 10
10
peptides |
36
spectra |
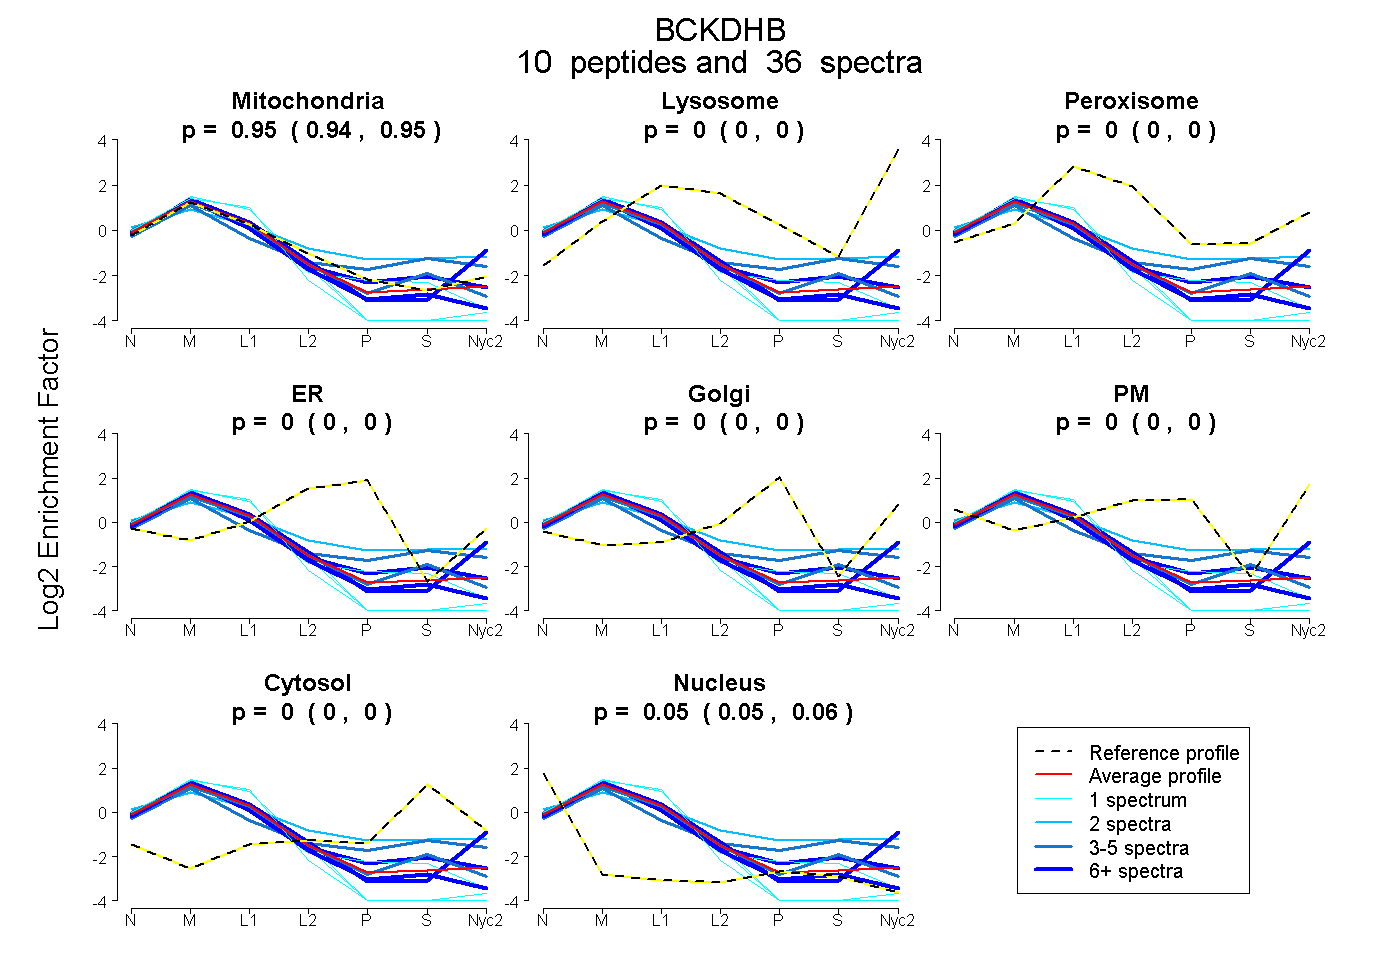 |
0.946
0.939 | 0.952 |
0.000
0.000 | 0.000 |
|
0.000
0.000 | 0.000 |
0.000
0.000 | 0.000 |
0.000
0.000 | 0.000 |
0.000
0.000 | 0.000 |
0.000
0.000 | 0.000 |
0.054
0.047 | 0.060 |
|
| | | Plot |
Mito |
|
Lyso or Perox |
|
ER |
Golgi |
PM |
Cytosol |
Nucleus |
|
| Expt B |
8
peptides |
21
spectra |
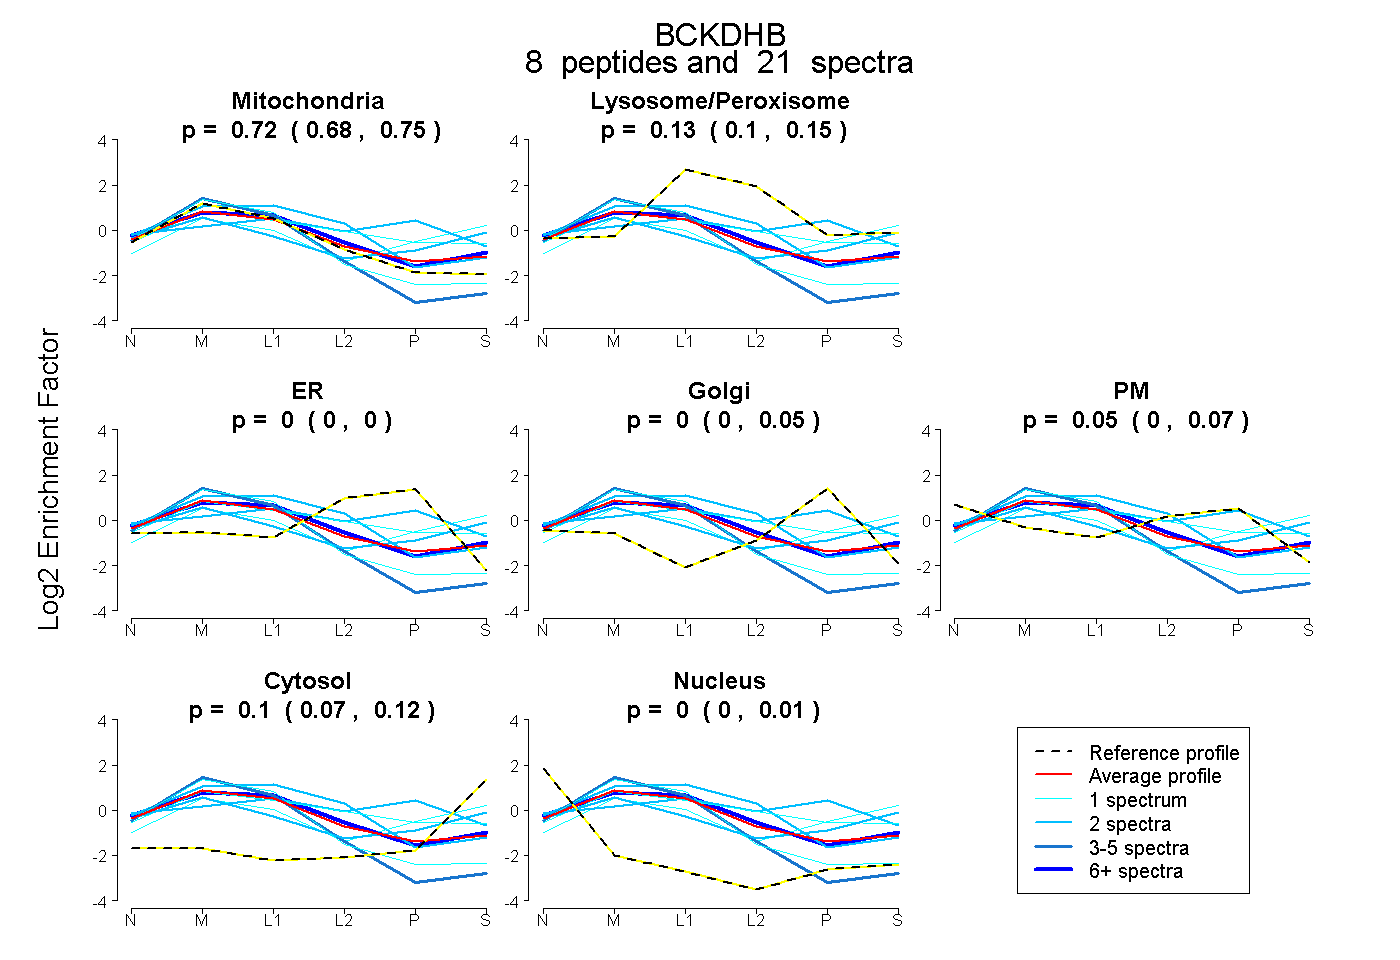 |
0.717
0.676 | 0.753 |
|
0.126
0.103 | 0.150 |
|
0.000
0.000 | 0.000 |
0.000
0.000 | 0.047 |
0.054
0.001 | 0.073 |
0.103
0.072 | 0.124 |
0.000
0.000 | 0.005 |
|
| 1 spectrum, TIVPWDVDTVCK |
0.963 |
|
0.000 |
|
0.000 |
0.000 |
0.000 |
0.000 |
0.037 |
|
| 2 spectra, CTVGLR |
0.690 |
|
0.310 |
|
0.000 |
0.000 |
0.000 |
0.000 |
0.000 |
|
| 8 spectra, AAVEQVPVEPYK |
0.679 |
|
0.206 |
|
0.000 |
0.000 |
0.000 |
0.089 |
0.026 |
|
| 2 spectra, EVASMAQEK |
0.160 |
|
0.425 |
|
0.000 |
0.396 |
0.000 |
0.019 |
0.000 |
|
| 4 spectra, LGVSCEVIDLR |
0.946 |
|
0.000 |
|
0.000 |
0.000 |
0.000 |
0.000 |
0.054 |
|
| 1 spectrum, CYDALR |
0.357 |
|
0.187 |
|
0.000 |
0.112 |
0.000 |
0.343 |
0.000 |
|
| 2 spectra, SGDLFNCGSLTIR |
0.449 |
|
0.092 |
|
0.000 |
0.035 |
0.110 |
0.313 |
0.000 |
|
| 1 spectrum, GLLLSCIEDK |
0.427 |
|
0.324 |
|
0.000 |
0.160 |
0.000 |
0.088 |
0.000 |
|
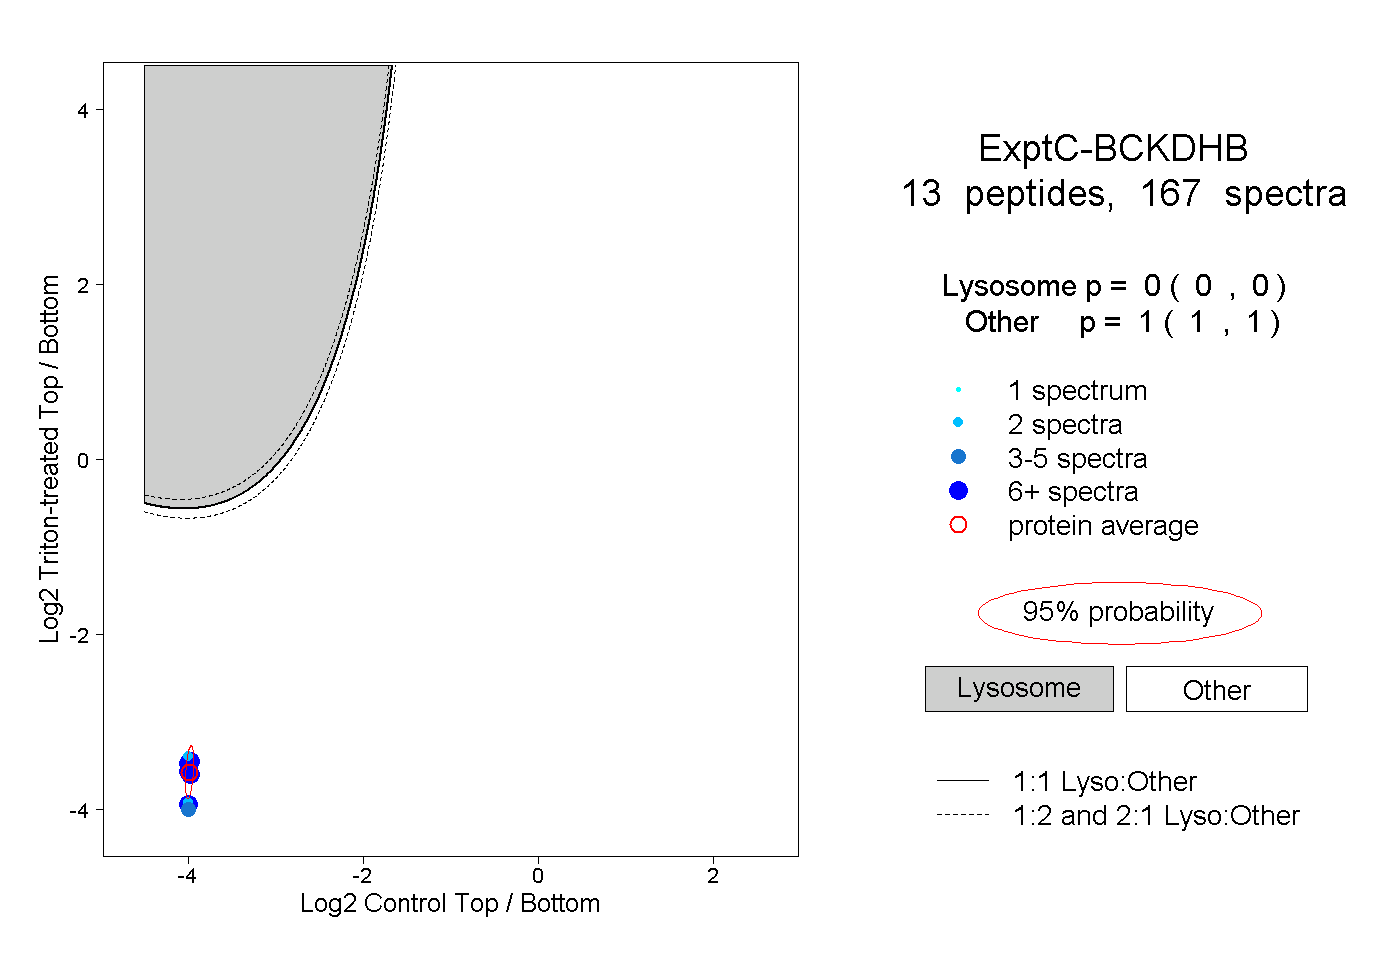
| | | Plot |
|
Lyso |
|
|
|
|
|
|
|
Other |
| Expt C |
13
peptides |
167
spectra |
 |
|
0.000
0.000 | 0.000 |
|
|
|
|
|
|
|
1.000
1.000 | 1.000 |
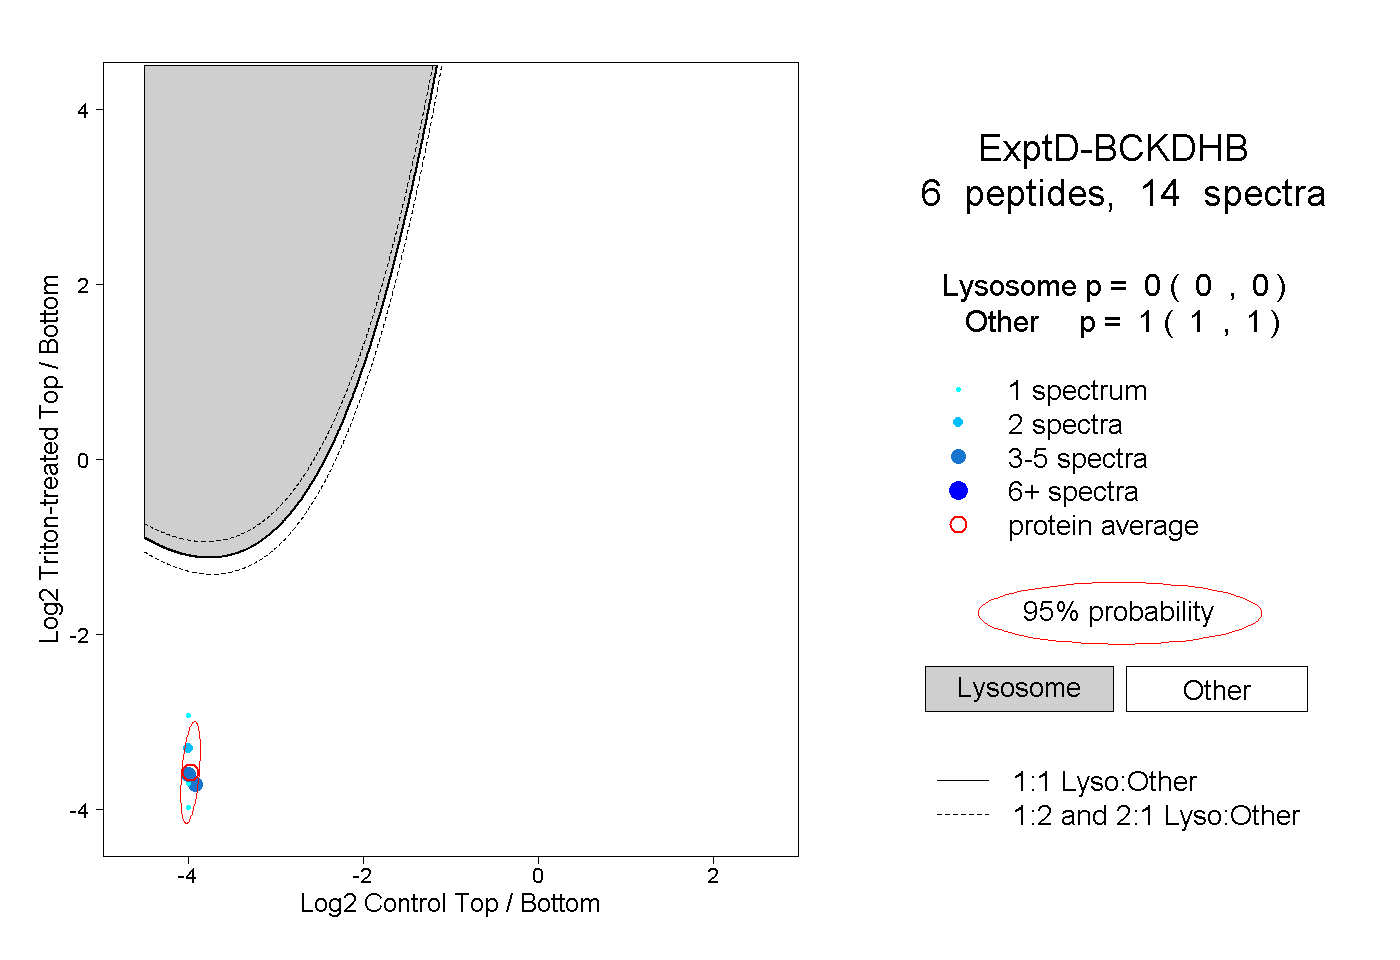
| | | Plot |
|
Lyso |
|
|
|
|
|
|
|
Other |
| Expt D |
6
peptides |
14
spectra |
 |
|
0.000
0.000 | 0.000 |
|
|
|
|
|
|
|
1.000
1.000 | 1.000 |