 8
8peptides
spectra

0.000 | 0.000
0.081 | 0.101
0.000 | 0.000
0.000 | 0.000
0.043 | 0.056
0.000 | 0.000
0.851 | 0.864
0.000 | 0.000
2peptides
spectra
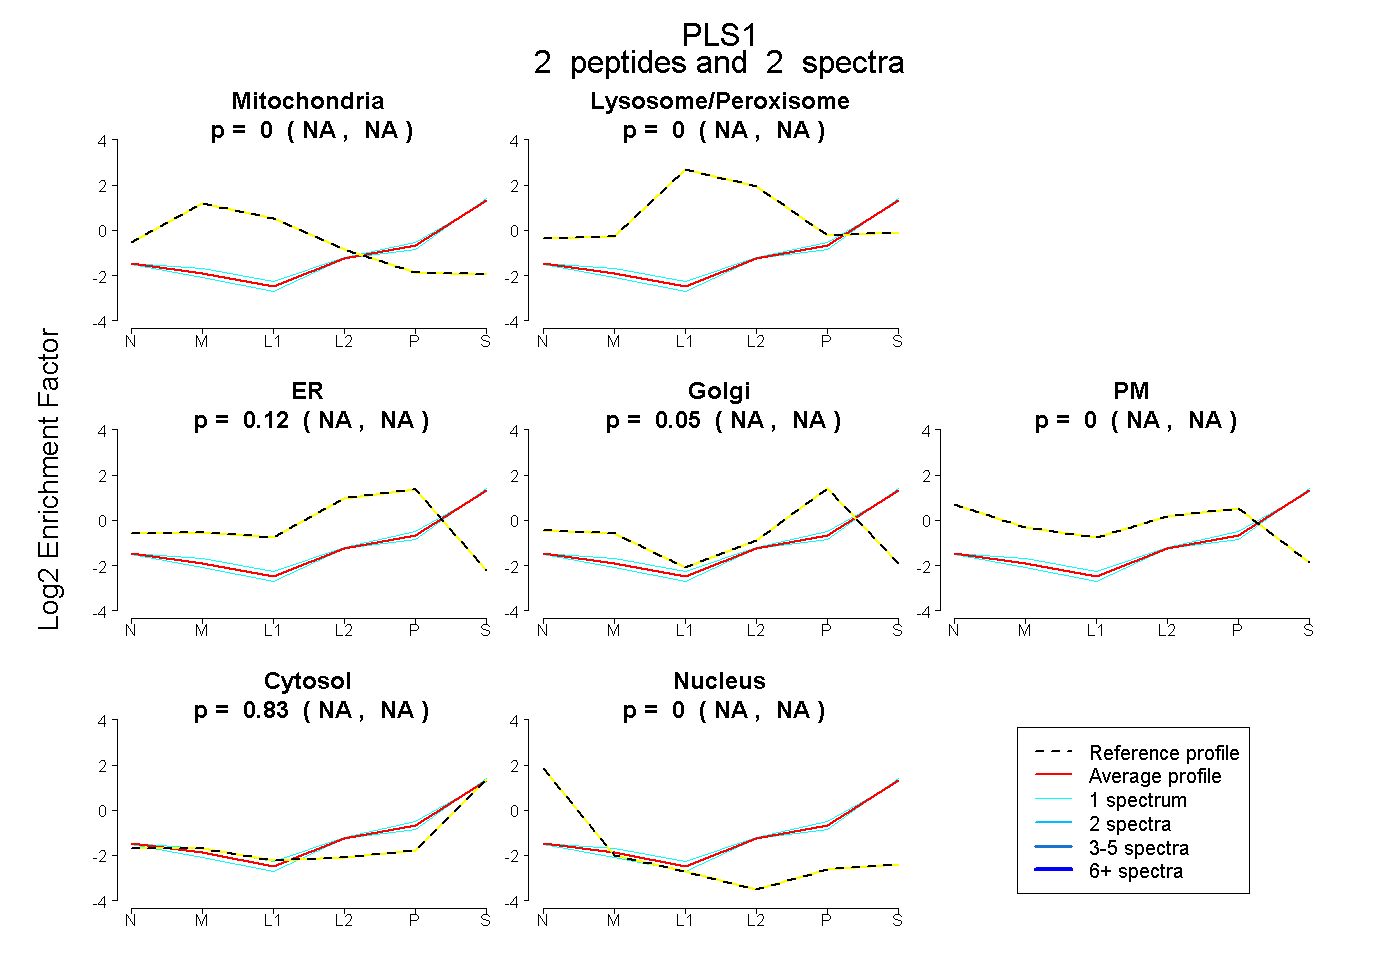
NA | NA
NA | NA
NA | NA
NA | NA
NA | NA
NA | NA
NA | NA
9peptides
spectra
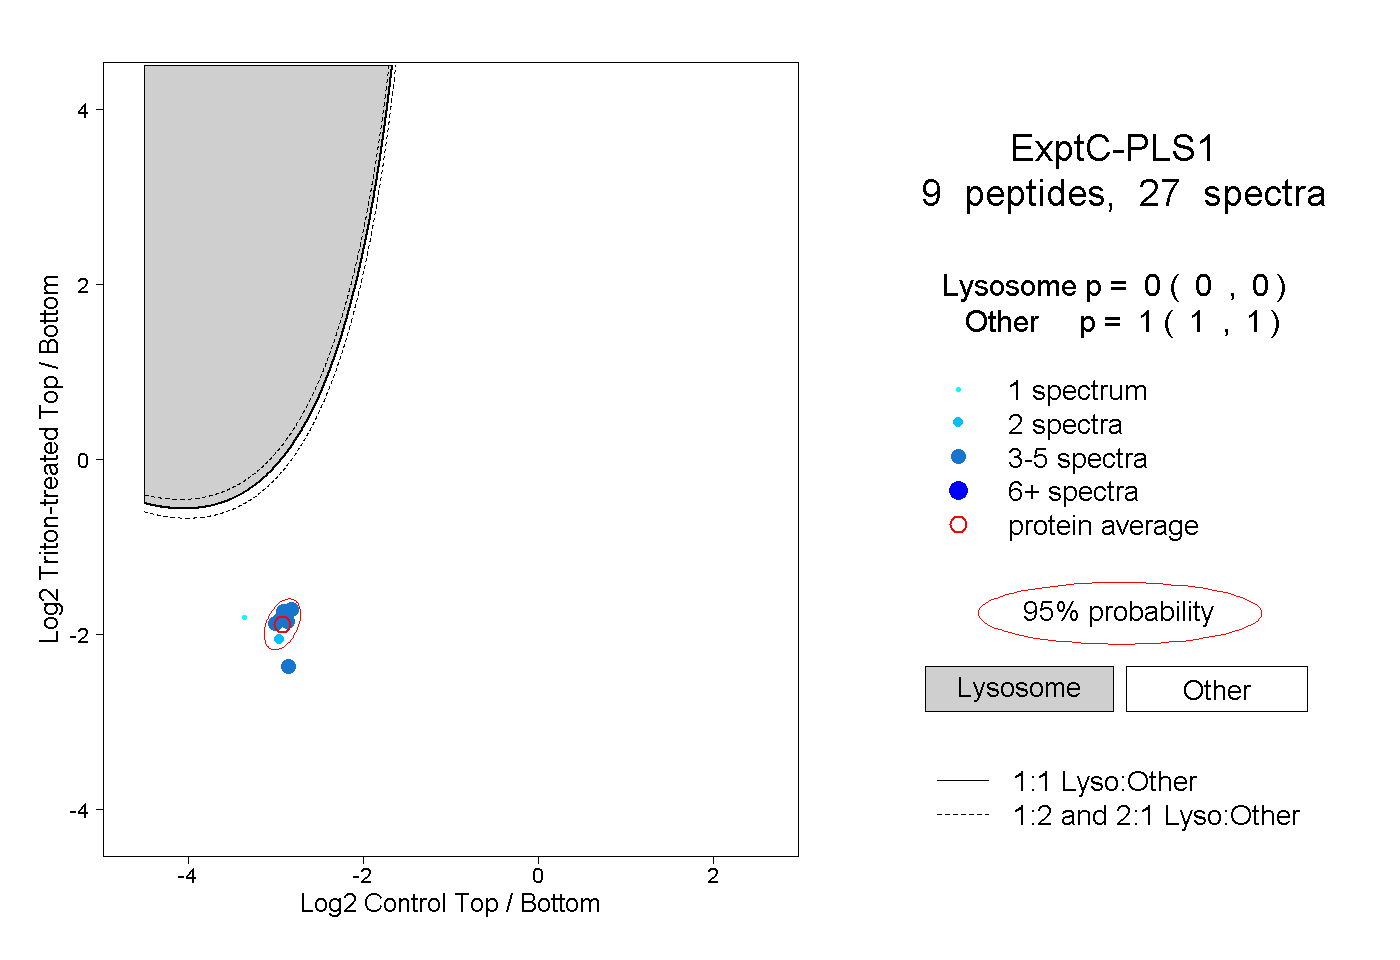
0.000 | 0.000
1.000 | 1.000