 8
8peptides
spectra

0.000 | 0.000
0.081 | 0.101
0.000 | 0.000
0.000 | 0.000
0.043 | 0.056
0.000 | 0.000
0.851 | 0.864
0.000 | 0.000
| Plot | Mito | Lyso | Perox | ER | Golgi | PM | Cytosol | Nucleus | |||||
| Expt A |
8 peptides |
26 spectra |
|
0.000 0.000 | 0.000 |
0.092 0.081 | 0.101 |
0.000 0.000 | 0.000 |
0.000 0.000 | 0.000 |
0.050 0.043 | 0.056 |
0.000 0.000 | 0.000 |
0.858 0.851 | 0.864 |
0.000 0.000 | 0.000 |
| 4 spectra, WVNQTLK | 0.000 | 0.205 | 0.000 | 0.000 | 0.002 | 0.000 | 0.793 | 0.000 | ||
| 1 spectrum, DGGSAVTIDLSGFNEK | 0.000 | 0.102 | 0.106 | 0.152 | 0.000 | 0.000 | 0.639 | 0.000 | ||
| 6 spectra, EGEELEELMK | 0.000 | 0.008 | 0.000 | 0.000 | 0.070 | 0.000 | 0.922 | 0.000 | ||
| 1 spectrum, VSDDIIIK | 0.000 | 0.012 | 0.000 | 0.000 | 0.063 | 0.000 | 0.925 | 0.000 | ||
| 2 spectra, TISNFSQDIK | 0.000 | 0.129 | 0.000 | 0.000 | 0.071 | 0.000 | 0.801 | 0.000 | ||
| 1 spectrum, VGLFADIEISR | 0.000 | 0.000 | 0.000 | 0.000 | 0.000 | 0.000 | 1.000 | 0.000 | ||
| 4 spectra, YAISVAR | 0.000 | 0.012 | 0.000 | 0.000 | 0.044 | 0.000 | 0.944 | 0.000 | ||
| 7 spectra, VLSDLGEGEK | 0.000 | 0.170 | 0.000 | 0.000 | 0.000 | 0.061 | 0.770 | 0.000 |
| Plot | Mito | Lyso or Perox | ER | Golgi | PM | Cytosol | Nucleus | ||||||
| Expt B |
2 peptides |
2 spectra |
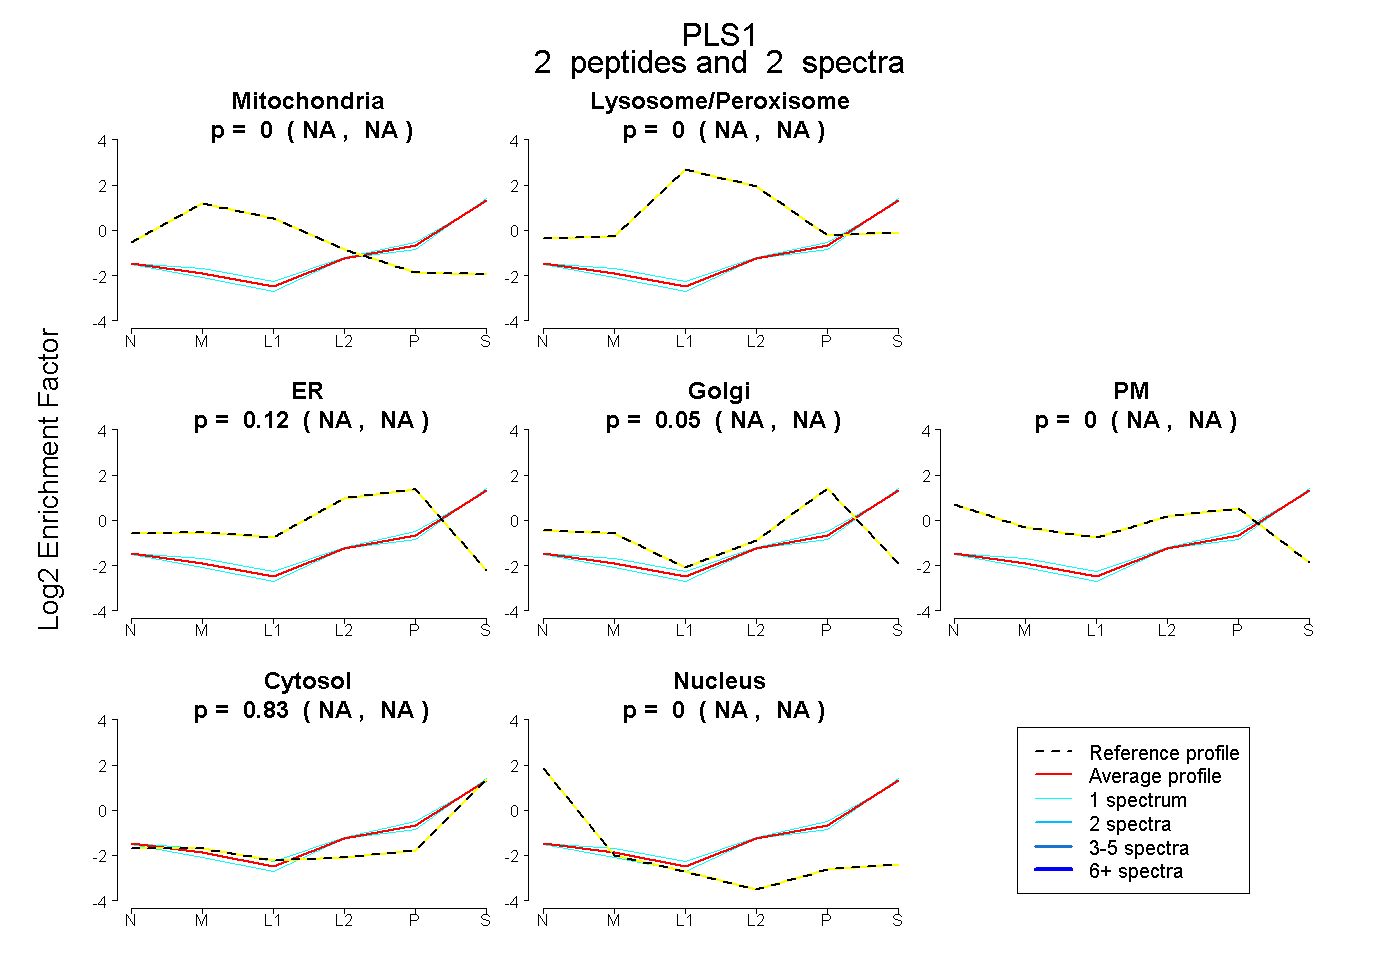 |
0.000 NA | NA |
0.000 NA | NA |
0.118 NA | NA |
0.050 NA | NA |
0.000 NA | NA |
0.832 NA | NA |
0.000 NA | NA |
|||
| Plot | Lyso | Other | |||||||||||
| Expt C |
9 peptides |
27 spectra |
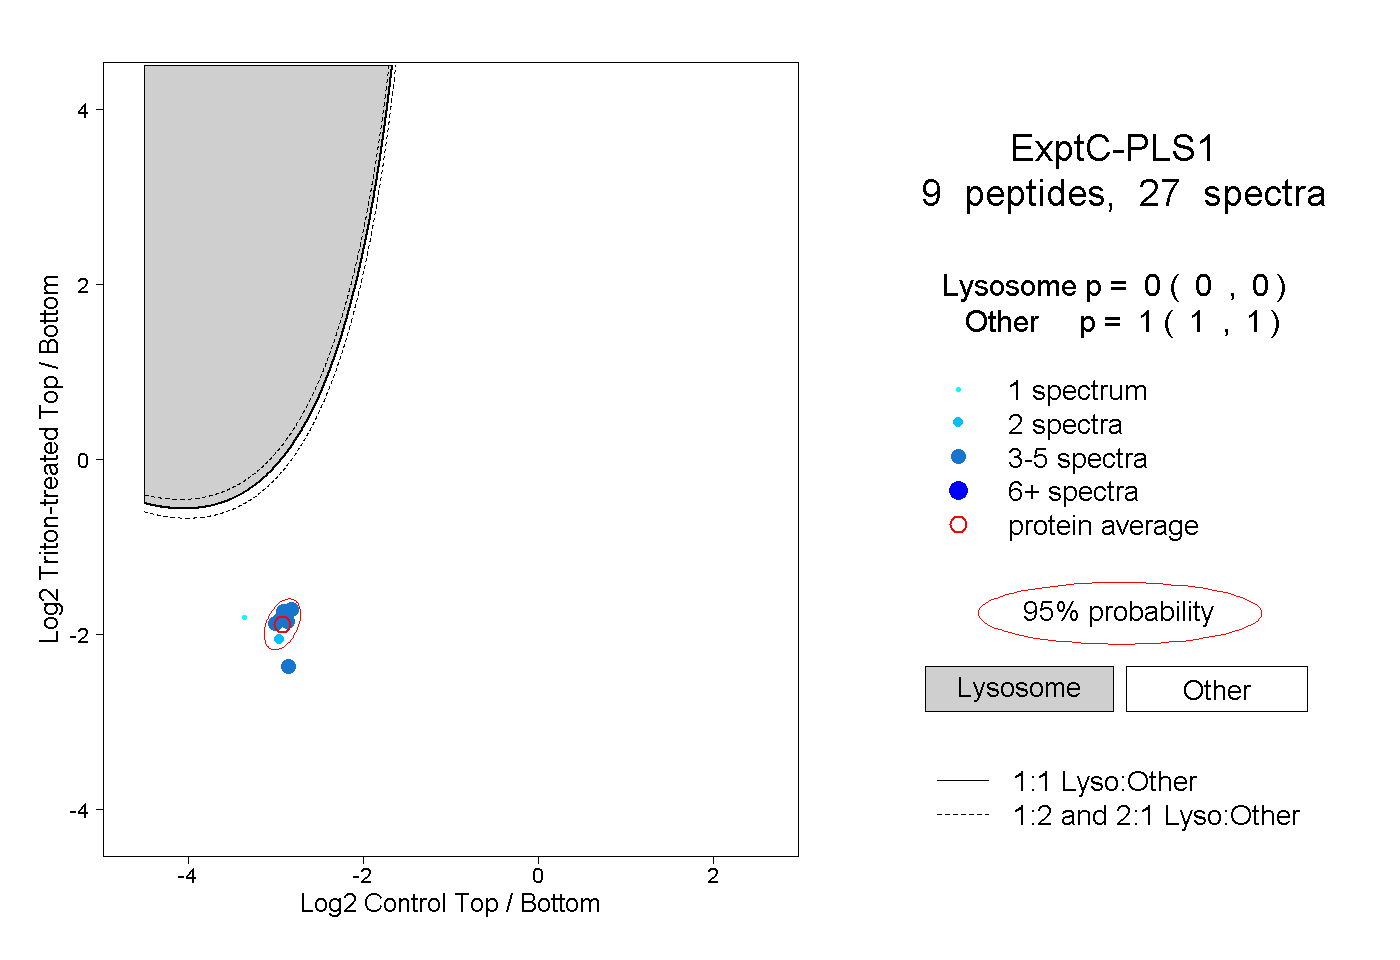 |
0.000 0.000 | 0.000 |
1.000 1.000 | 1.000 |