 10
10peptides
spectra
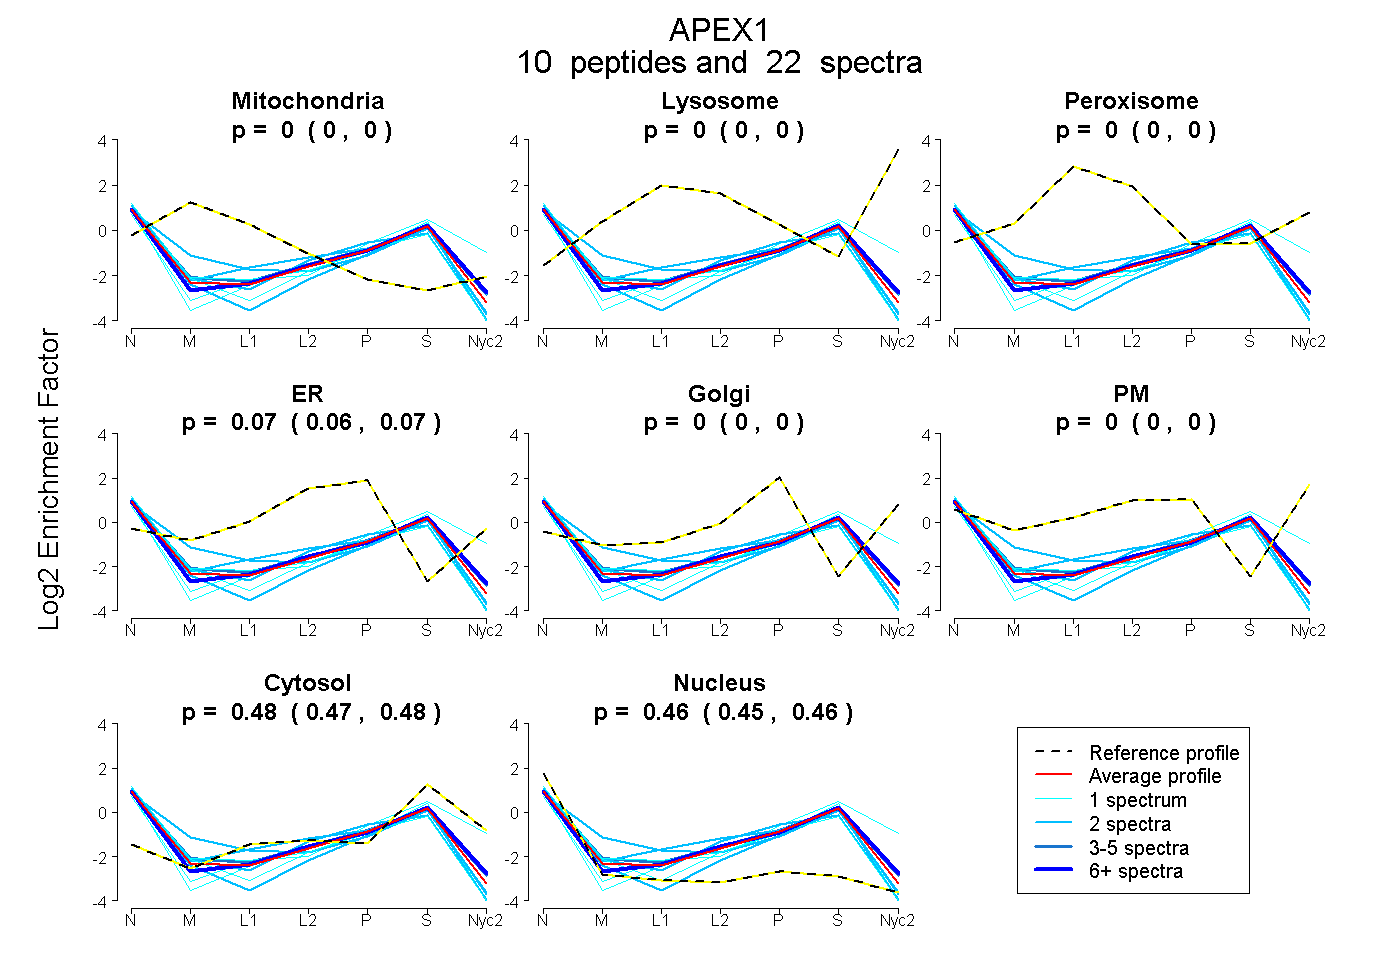
0.000 | 0.000
0.000 | 0.000
0.000 | 0.000
0.059 | 0.070
0.000 | 0.000
0.000 | 0.000
0.470 | 0.482
0.451 | 0.465
2peptides
spectra
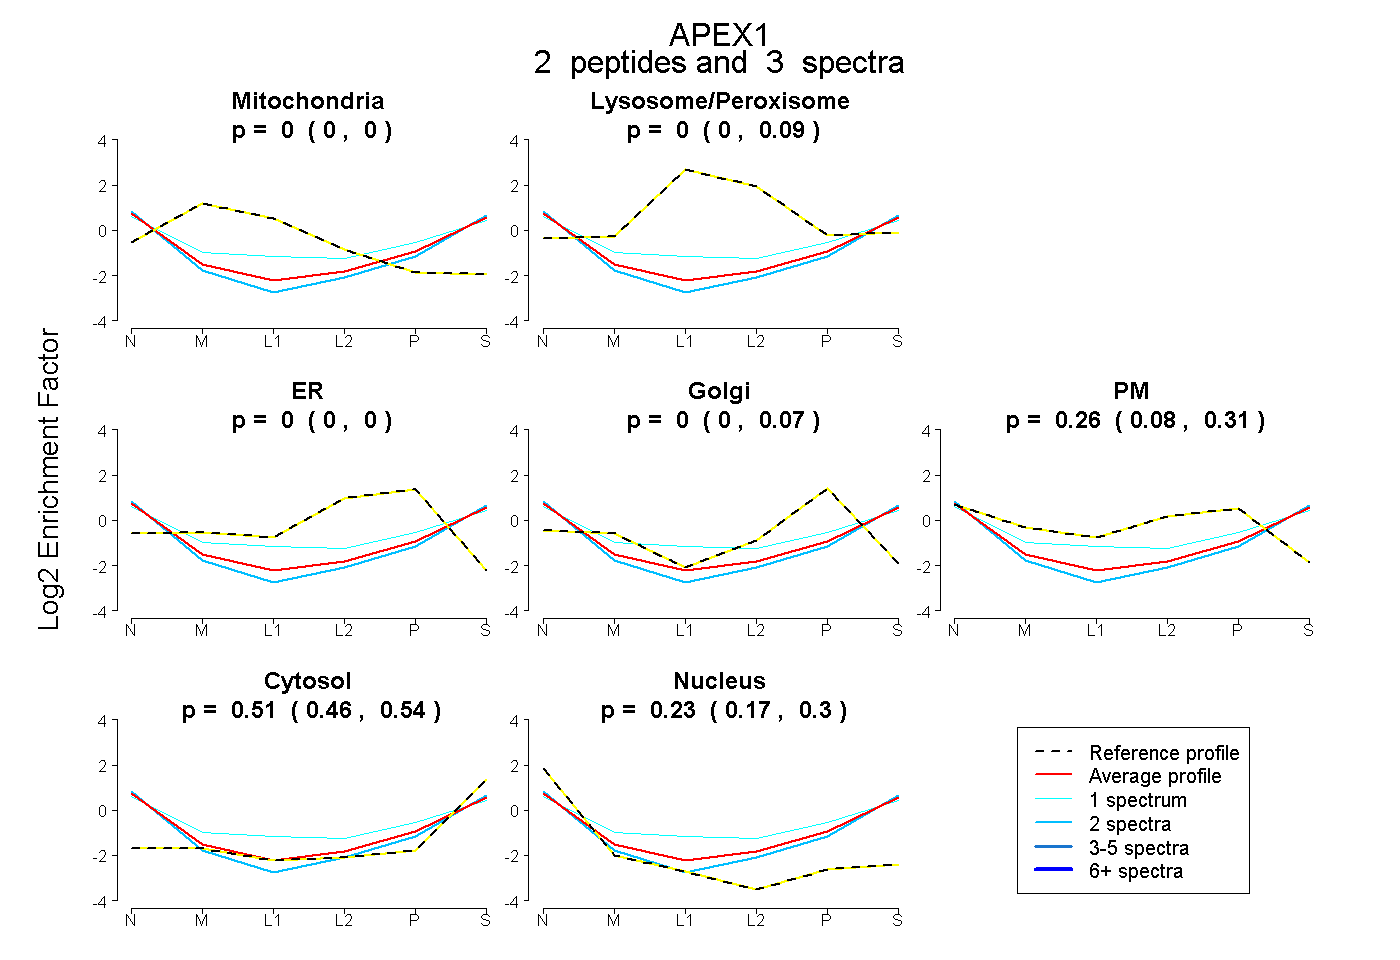
0.000 | 0.000
0.000 | 0.089
0.000 | 0.000
0.000 | 0.073
0.075 | 0.305
0.456 | 0.536
0.174 | 0.297
3peptides
spectra
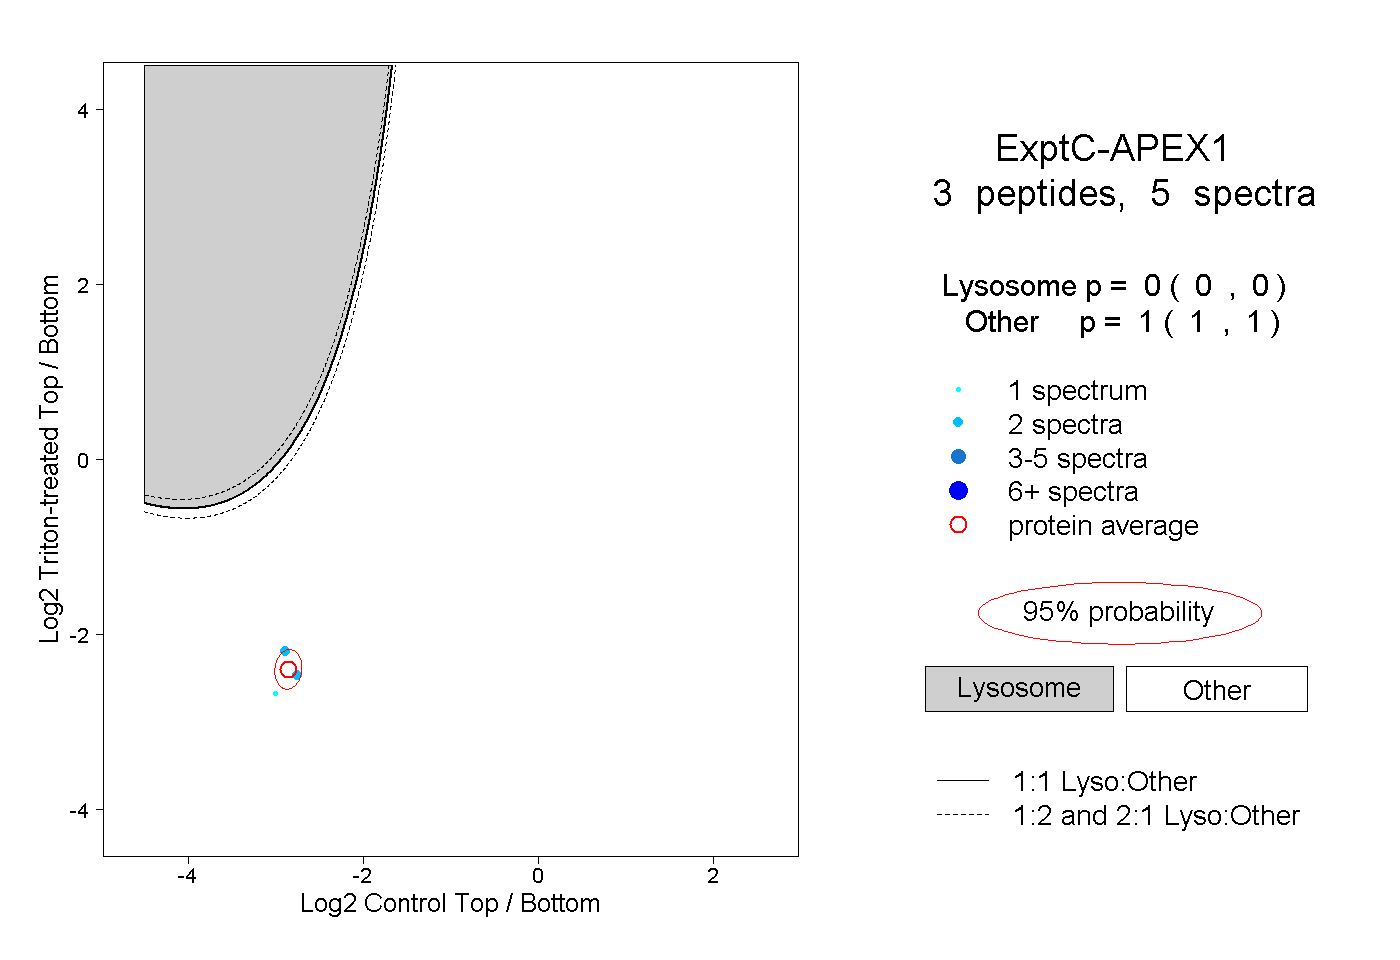
0.000 | 0.000
1.000 | 1.000
2peptides
spectra
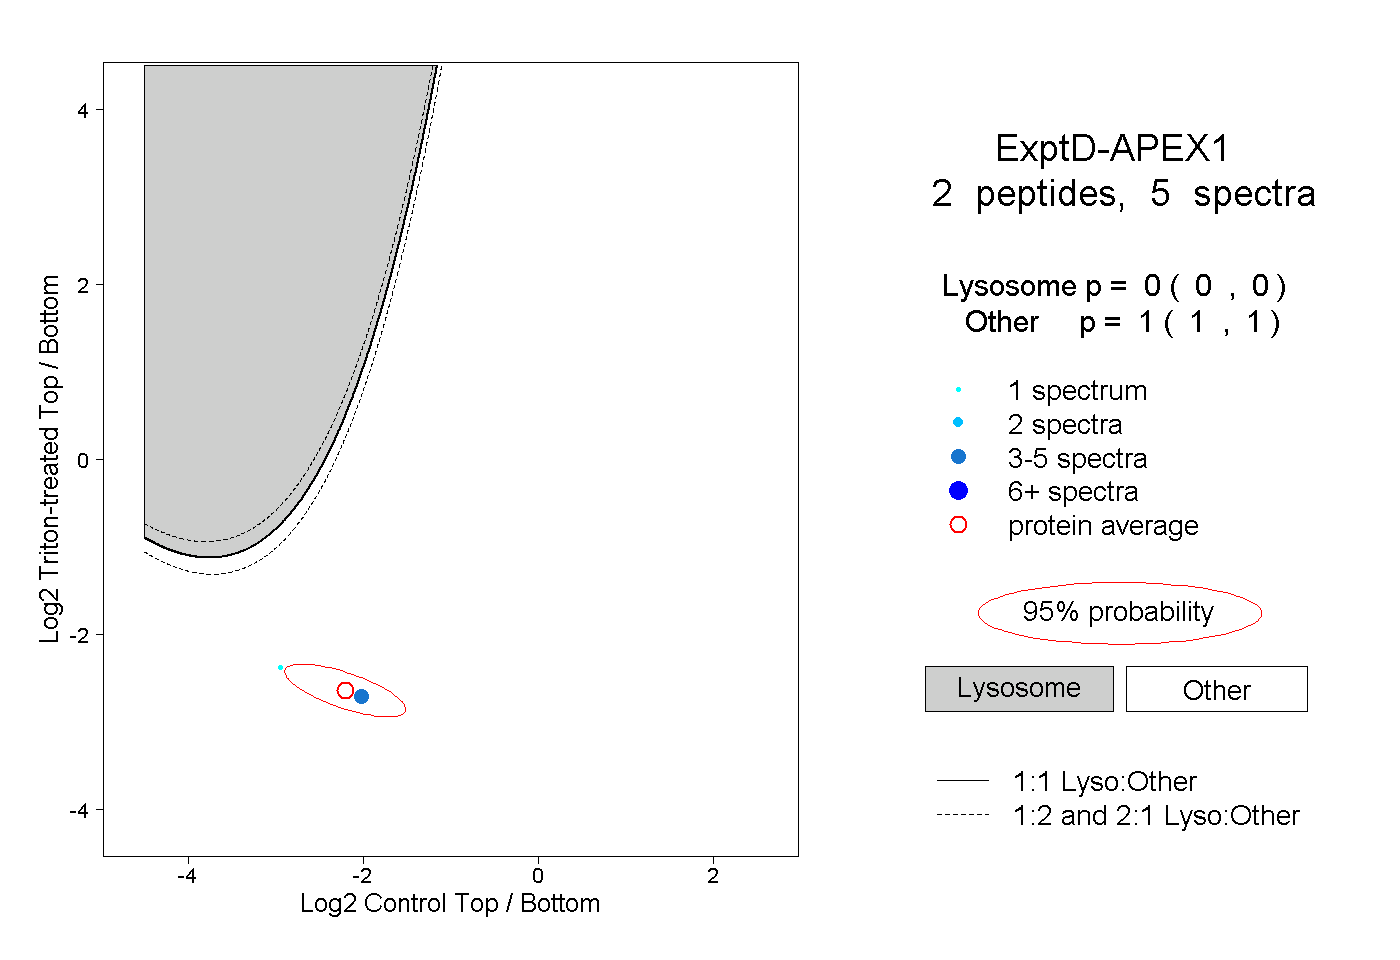
0.000 | 0.000
1.000 | 1.000