 10
10peptides
spectra
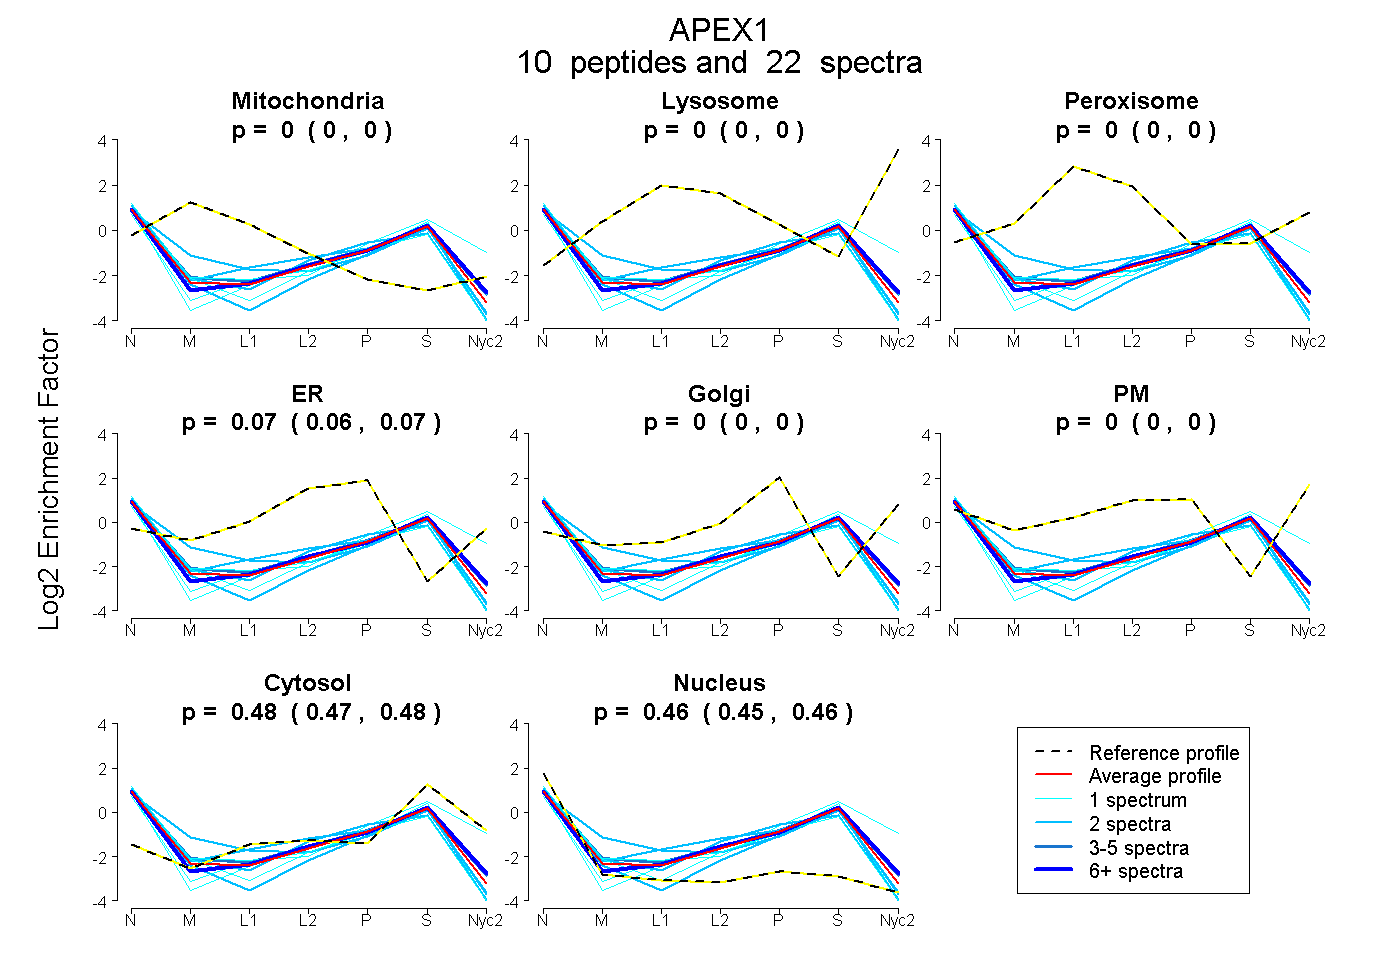
0.000 | 0.000
0.000 | 0.000
0.000 | 0.000
0.059 | 0.070
0.000 | 0.000
0.000 | 0.000
0.470 | 0.482
0.451 | 0.465
| Plot | Mito | Lyso | Perox | ER | Golgi | PM | Cytosol | Nucleus | |||||
| Expt A |
10 peptides |
22 spectra |
|
0.000 0.000 | 0.000 |
0.000 0.000 | 0.000 |
0.000 0.000 | 0.000 |
0.065 0.059 | 0.070 |
0.000 0.000 | 0.000 |
0.000 0.000 | 0.000 |
0.477 0.470 | 0.482 |
0.458 0.451 | 0.465 |
| 2 spectra, NAGFTPQER | 0.000 | 0.000 | 0.000 | 0.122 | 0.000 | 0.000 | 0.351 | 0.527 | ||
| 4 spectra, ICSWNVDGLR | 0.000 | 0.000 | 0.000 | 0.098 | 0.000 | 0.000 | 0.484 | 0.418 | ||
| 1 spectrum, SEPETK | 0.000 | 0.000 | 0.000 | 0.062 | 0.000 | 0.000 | 0.519 | 0.419 | ||
| 1 spectrum, KPLVLCGDLNVAHEEIDLR | 0.000 | 0.000 | 0.000 | 0.000 | 0.000 | 0.000 | 0.494 | 0.506 | ||
| 2 spectra, GLDWVK | 0.205 | 0.000 | 0.000 | 0.002 | 0.000 | 0.000 | 0.410 | 0.383 | ||
| 1 spectrum, EGYSGVGLLSR | 0.000 | 0.000 | 0.000 | 0.000 | 0.115 | 0.000 | 0.622 | 0.263 | ||
| 2 spectra, LDYFLLSHSLLPALCDSK | 0.000 | 0.000 | 0.000 | 0.125 | 0.000 | 0.000 | 0.442 | 0.434 | ||
| 2 spectra, EEAPDILCLQETK | 0.000 | 0.000 | 0.000 | 0.000 | 0.000 | 0.000 | 0.408 | 0.592 | ||
| 1 spectrum, QGFGEMLQAVPLADSFR | 0.000 | 0.000 | 0.000 | 0.041 | 0.000 | 0.000 | 0.361 | 0.598 | ||
| 6 spectra, VSYGIGEEEHDQEGR | 0.000 | 0.000 | 0.000 | 0.057 | 0.000 | 0.000 | 0.519 | 0.424 |
| Plot | Mito | Lyso or Perox | ER | Golgi | PM | Cytosol | Nucleus | ||||||
| Expt B |
2 peptides |
3 spectra |
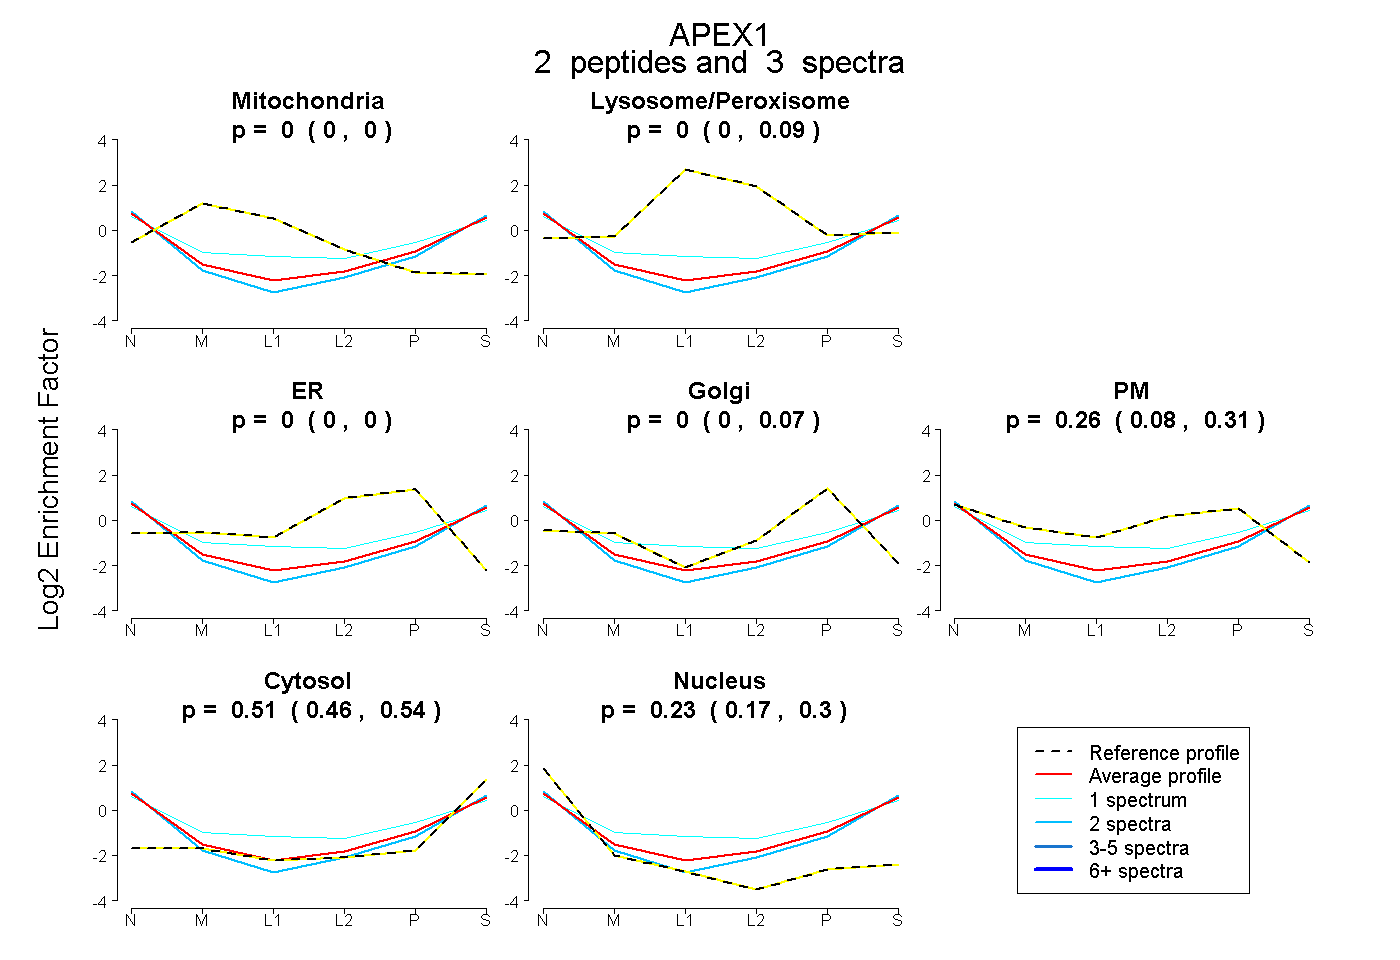 |
0.000 0.000 | 0.000 |
0.000 0.000 | 0.089 |
0.000 0.000 | 0.000 |
0.000 0.000 | 0.073 |
0.255 0.075 | 0.305 |
0.514 0.456 | 0.536 |
0.230 0.174 | 0.297 |
|||
| Plot | Lyso | Other | |||||||||||
| Expt C |
3 peptides |
5 spectra |
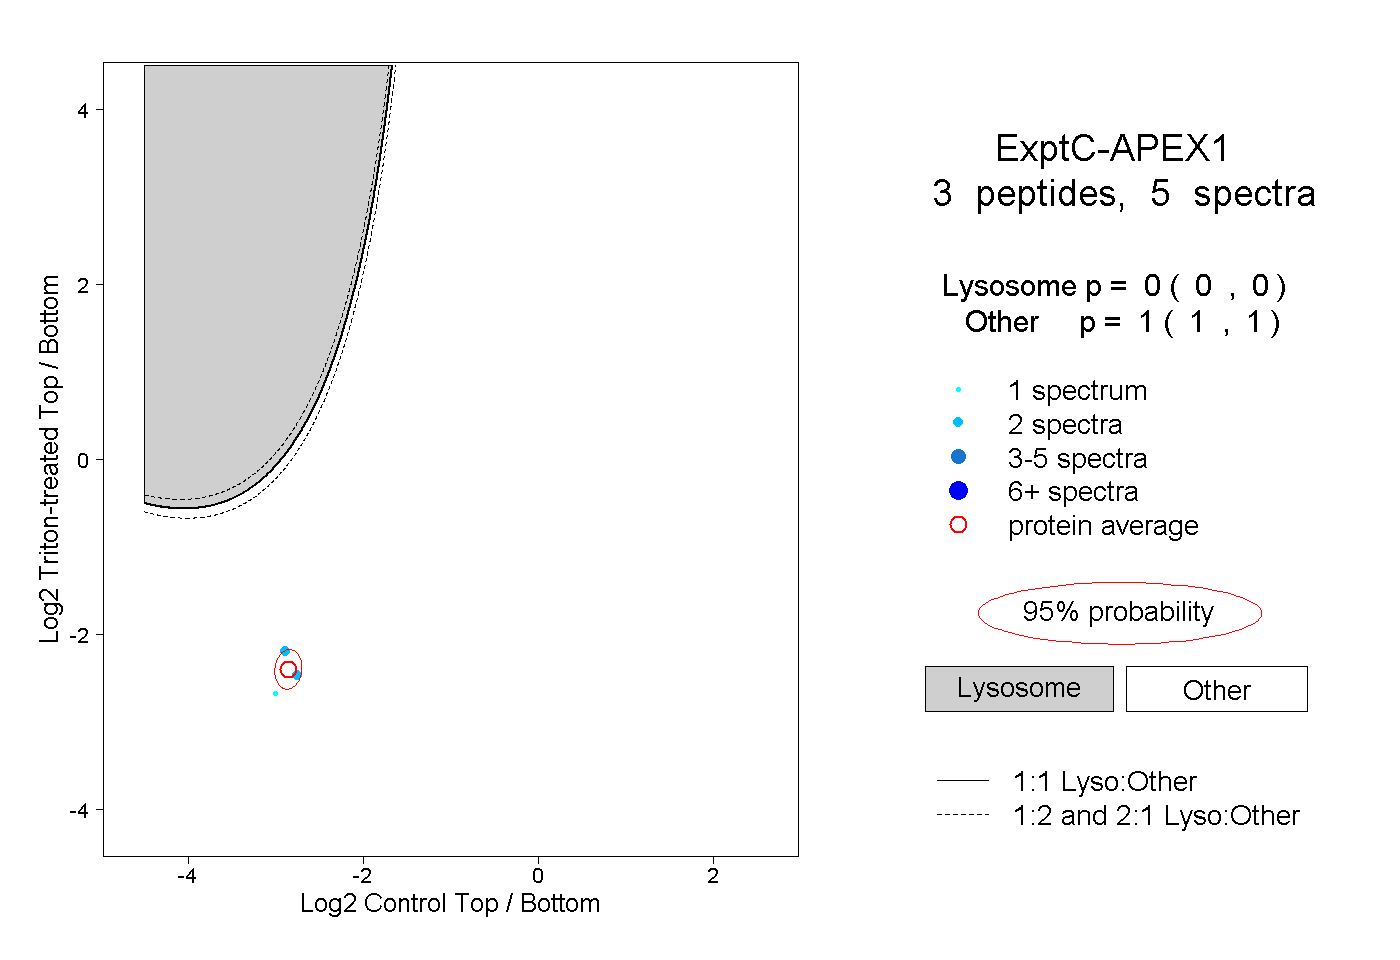 |
0.000 0.000 | 0.000 |
1.000 1.000 | 1.000 |
||||||||
| Plot | Lyso | Other | |||||||||||
| Expt D |
2 peptides |
5 spectra |
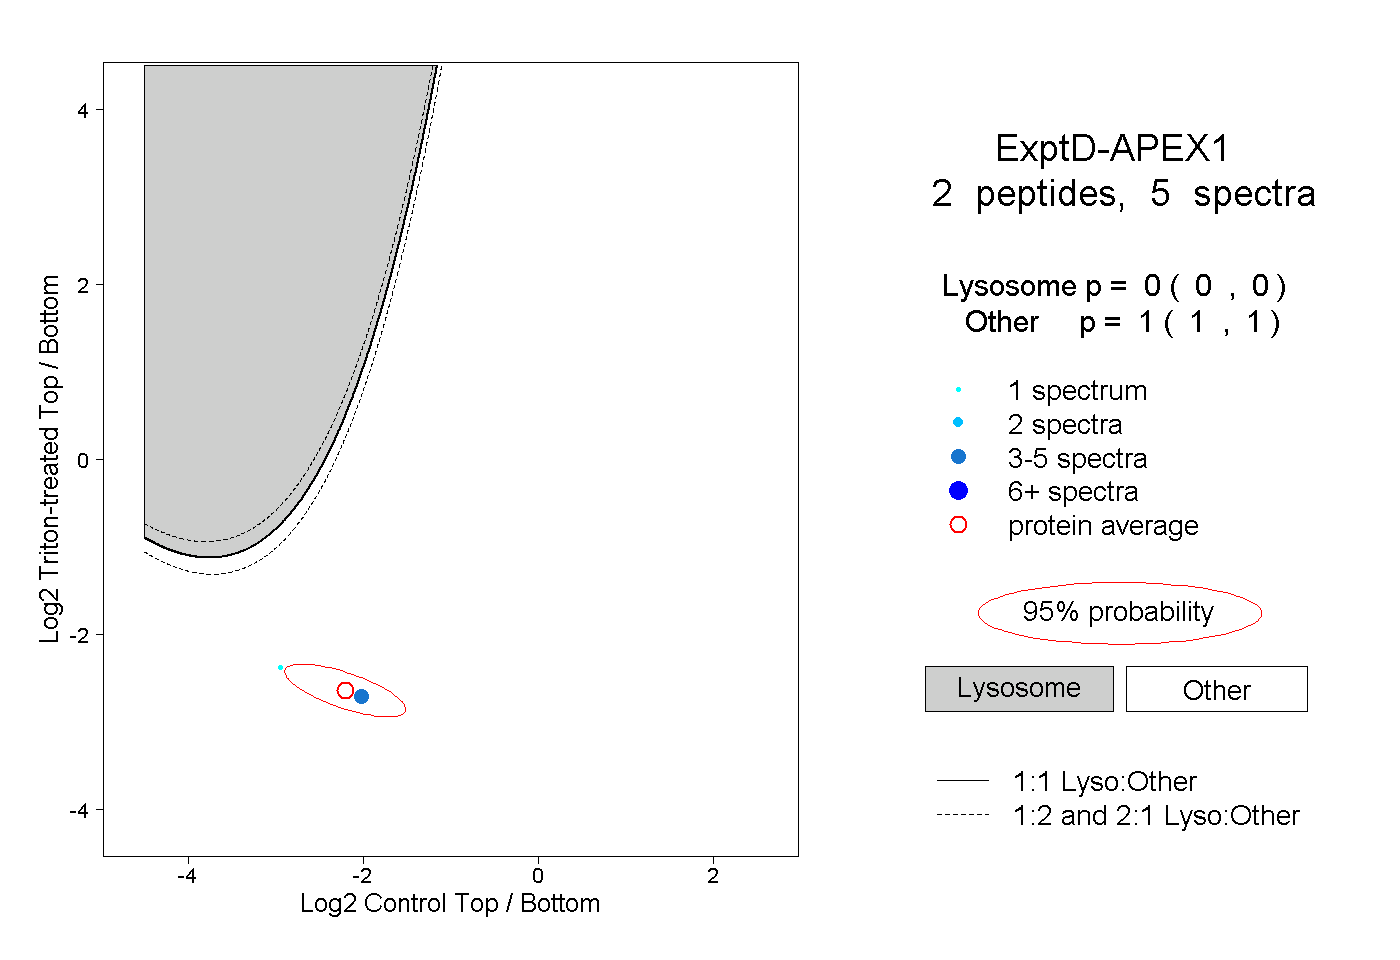 |
0.000 0.000 | 0.000 |
1.000 1.000 | 1.000 |