 4
4peptides
spectra
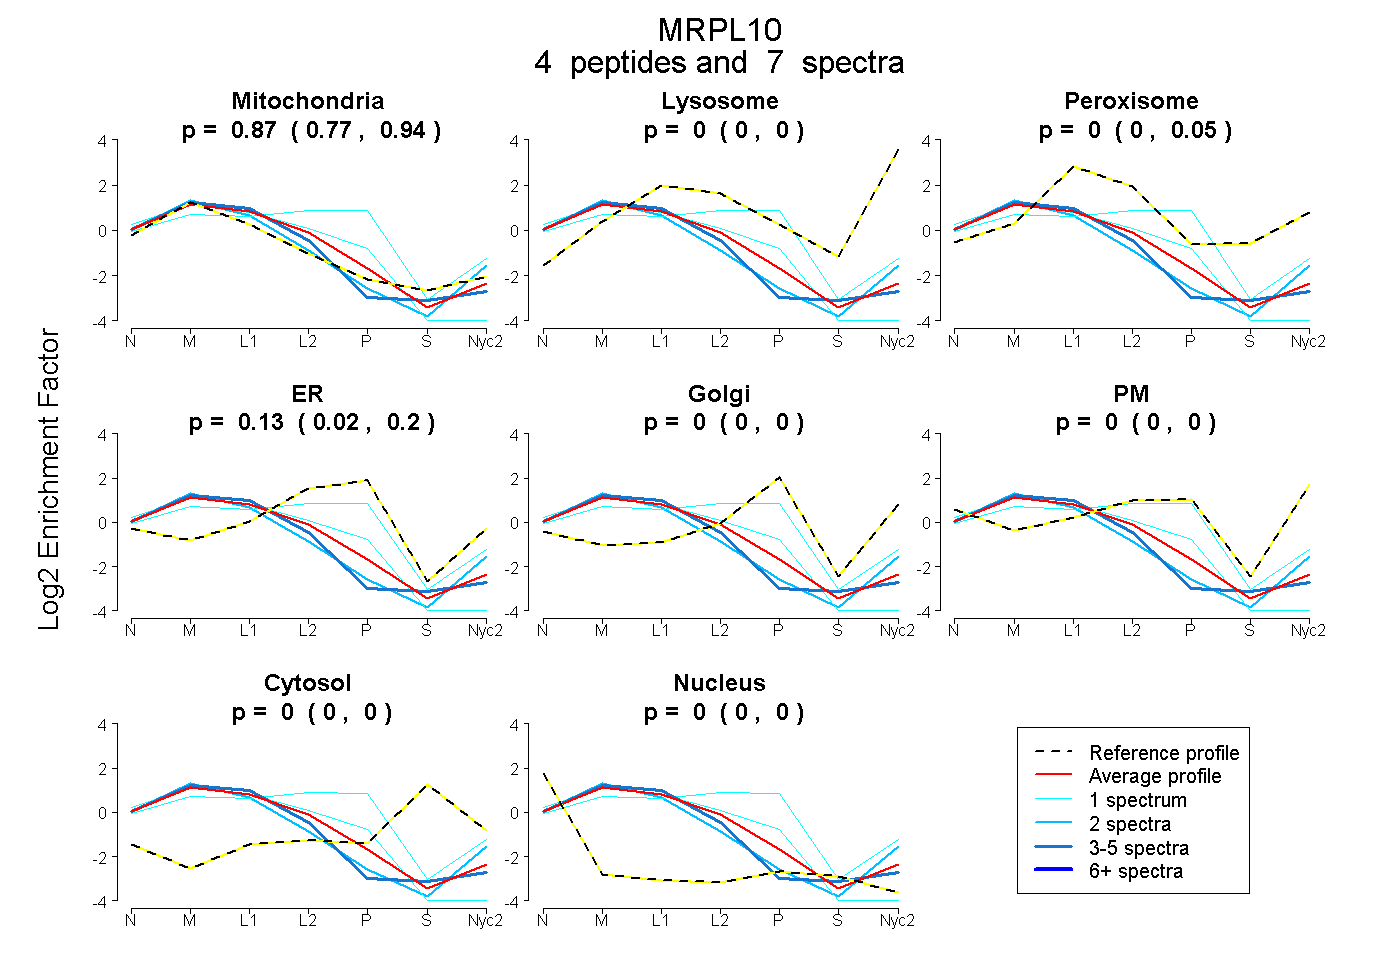
0.772 | 0.938
0.000 | 0.000
0.000 | 0.048
0.024 | 0.205
0.000 | 0.000
0.000 | 0.000
0.000 | 0.000
0.000 | 0.000
1peptide
spectrum
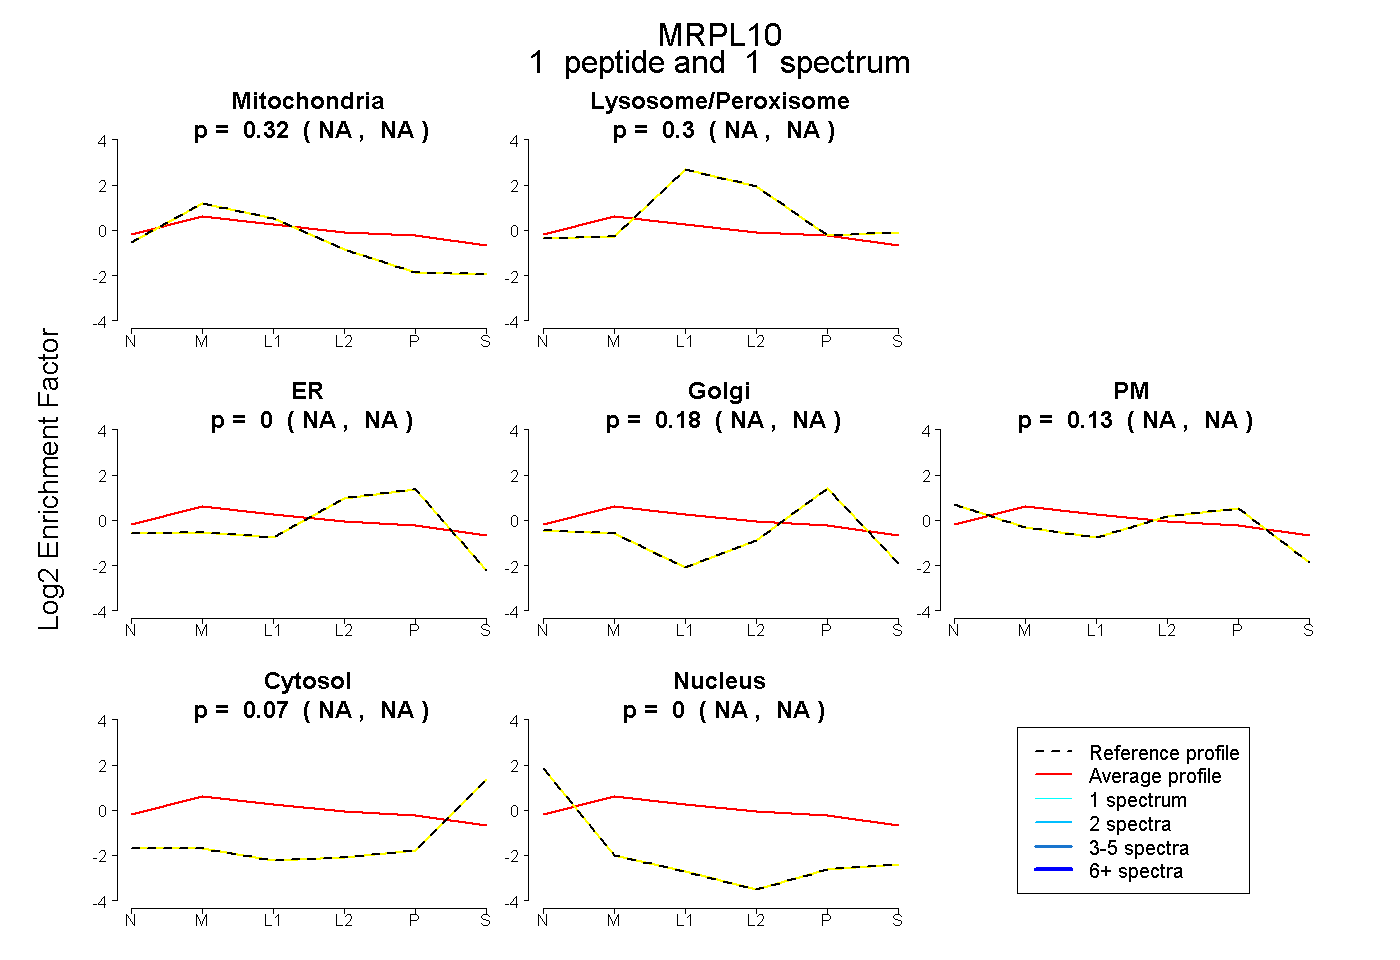
NA | NA
NA | NA
NA | NA
NA | NA
NA | NA
NA | NA
NA | NA
6peptides
spectra
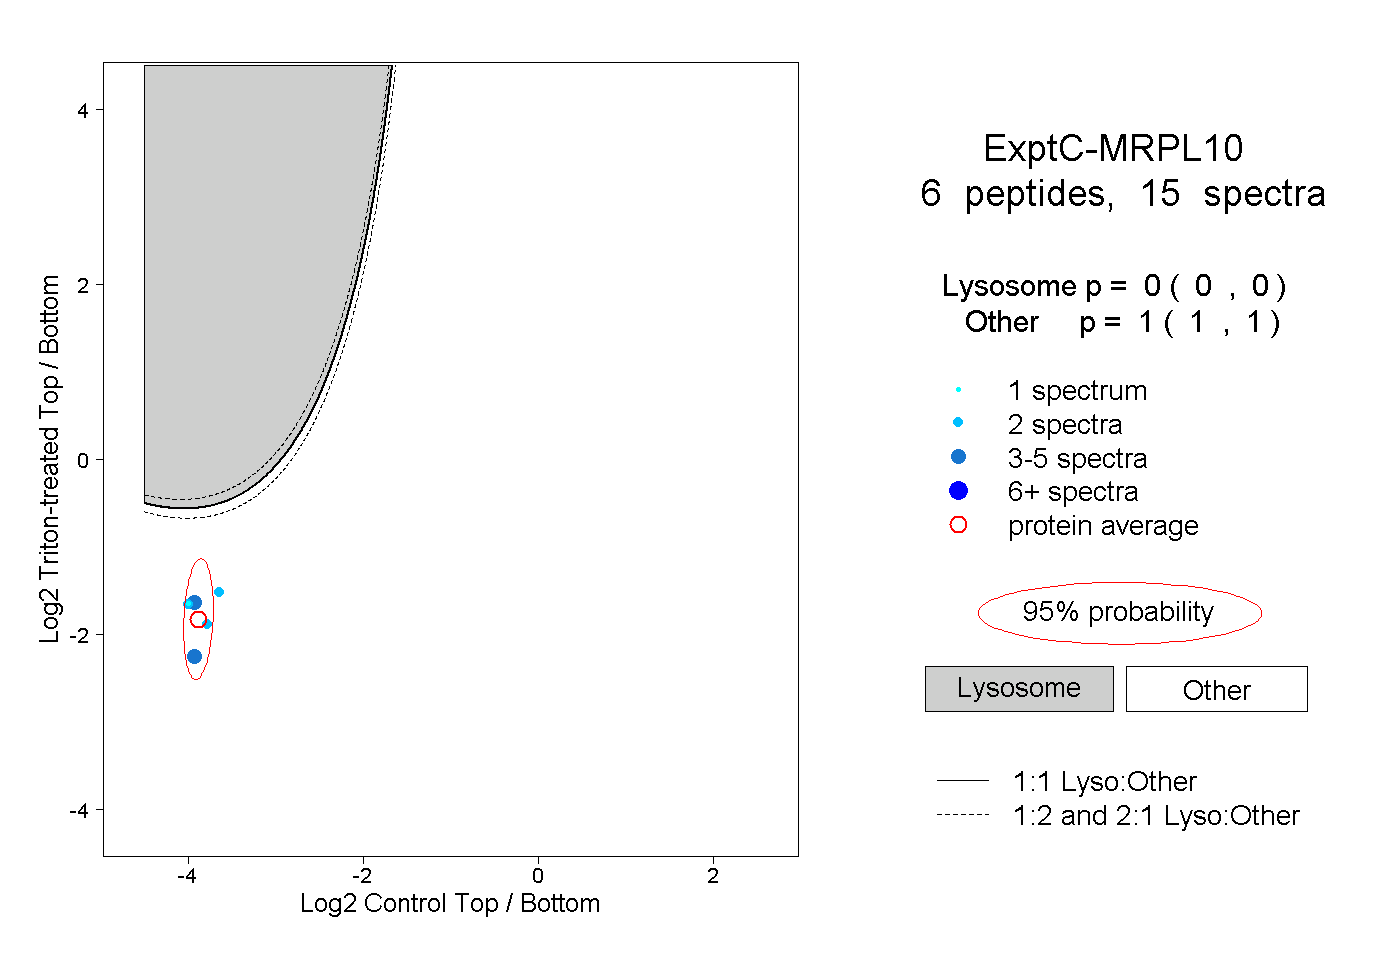
0.000 | 0.000
1.000 | 1.000