 4
4peptides
spectra
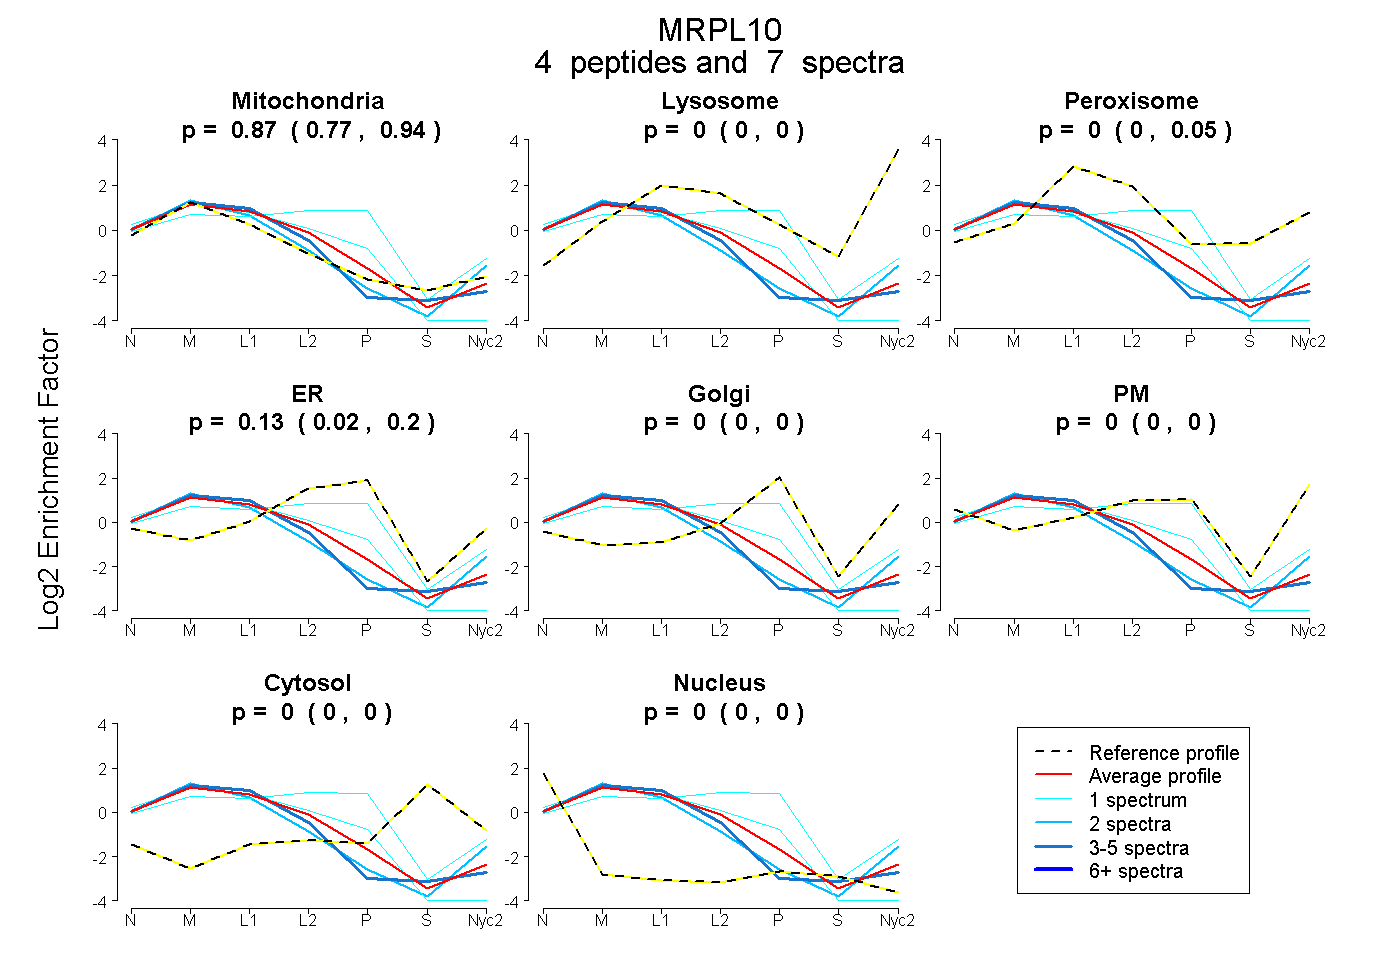
0.772 | 0.938
0.000 | 0.000
0.000 | 0.048
0.024 | 0.205
0.000 | 0.000
0.000 | 0.000
0.000 | 0.000
0.000 | 0.000
| Plot | Mito | Lyso | Perox | ER | Golgi | PM | Cytosol | Nucleus | |||||
| Expt A |
4 peptides |
7 spectra |
|
0.870 0.772 | 0.938 |
0.000 0.000 | 0.000 |
0.000 0.000 | 0.048 |
0.130 0.024 | 0.205 |
0.000 0.000 | 0.000 |
0.000 0.000 | 0.000 |
0.000 0.000 | 0.000 |
0.000 0.000 | 0.000 |
| 3 spectra, VMHFQR | 1.000 | 0.000 | 0.000 | 0.000 | 0.000 | 0.000 | 0.000 | 0.000 | ||
| 1 spectrum, QGFVEYAK | 0.354 | 0.000 | 0.002 | 0.644 | 0.000 | 0.000 | 0.000 | 0.000 | ||
| 2 spectra, LPSLDR | 0.978 | 0.000 | 0.000 | 0.000 | 0.000 | 0.022 | 0.000 | 0.000 | ||
| 1 spectrum, LQGELVGGLTHLTAQTR | 0.822 | 0.000 | 0.000 | 0.170 | 0.000 | 0.000 | 0.000 | 0.008 |
| Plot | Mito | Lyso or Perox | ER | Golgi | PM | Cytosol | Nucleus | ||||||
| Expt B |
1 peptide |
1 spectrum |
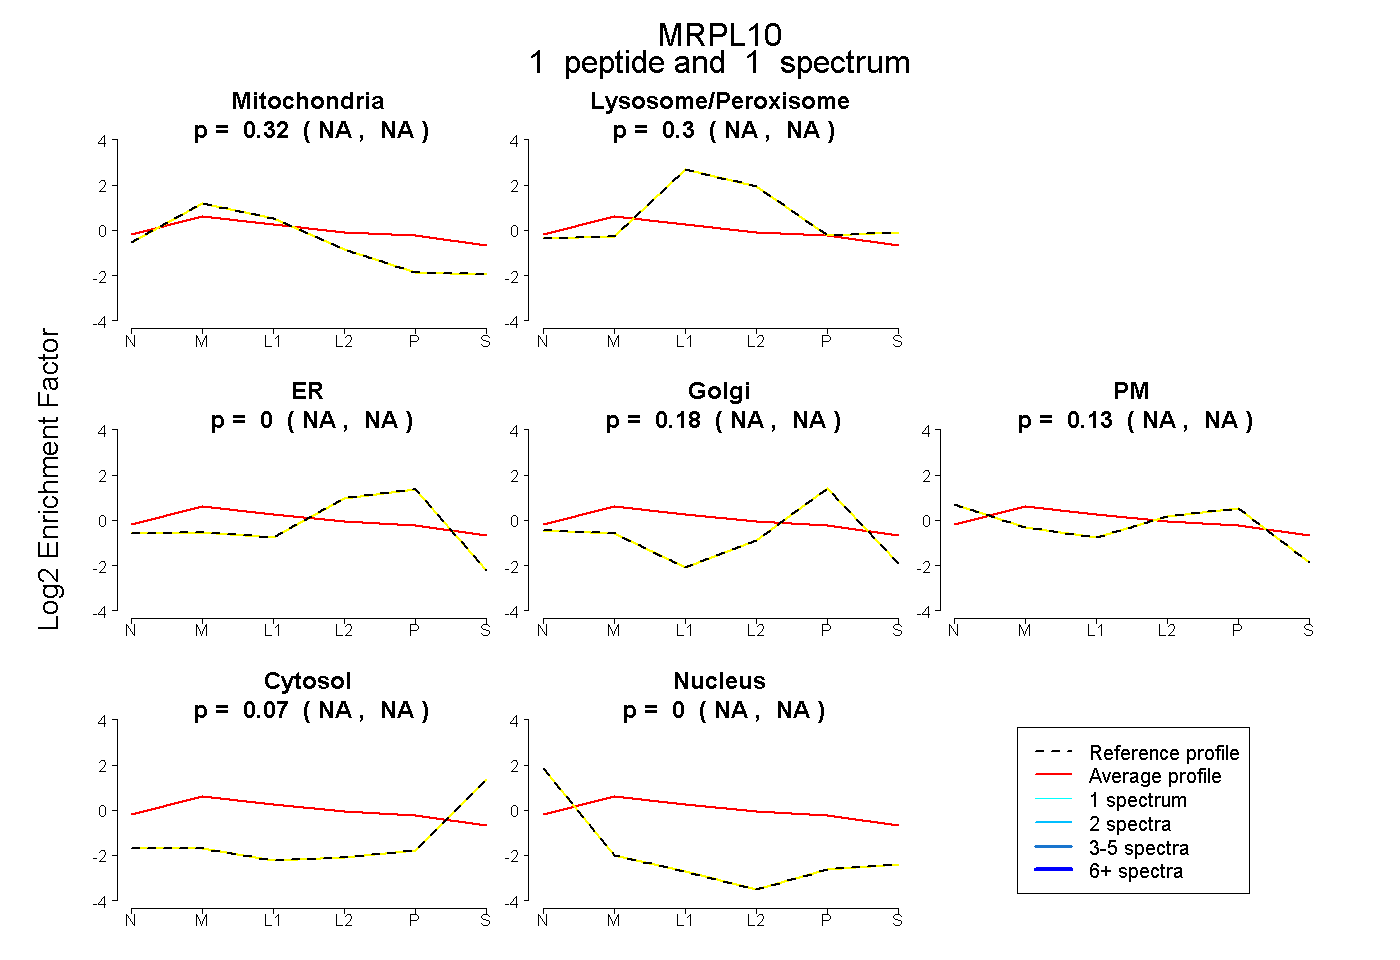 |
0.322 NA | NA |
0.298 NA | NA |
0.000 NA | NA |
0.181 NA | NA |
0.131 NA | NA |
0.068 NA | NA |
0.000 NA | NA |
|||
| Plot | Lyso | Other | |||||||||||
| Expt C |
6 peptides |
15 spectra |
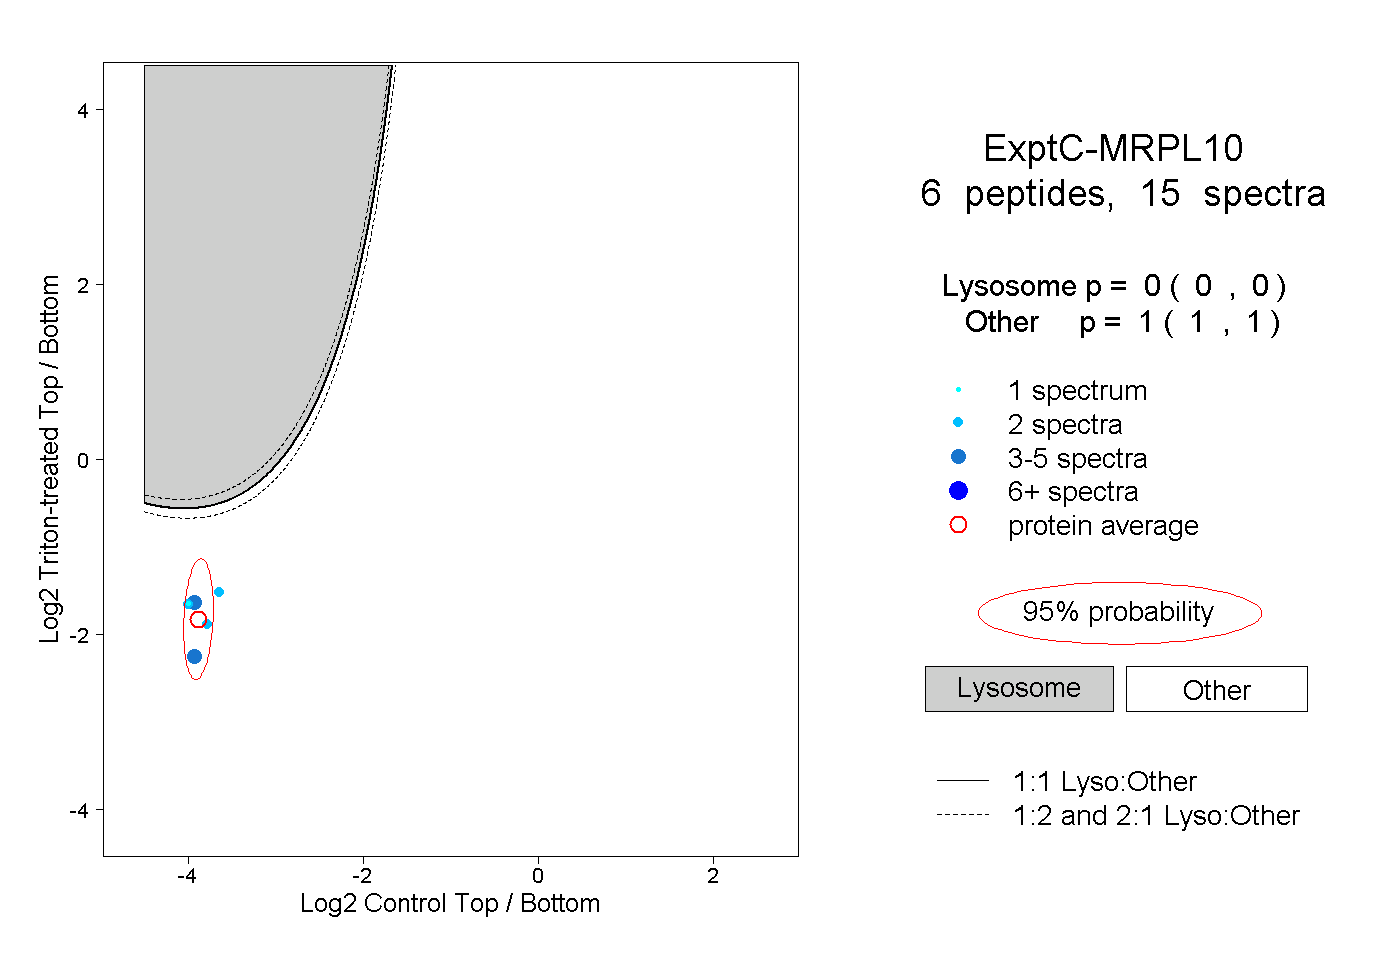 |
0.000 0.000 | 0.000 |
1.000 1.000 | 1.000 |