 5
5peptides
spectra
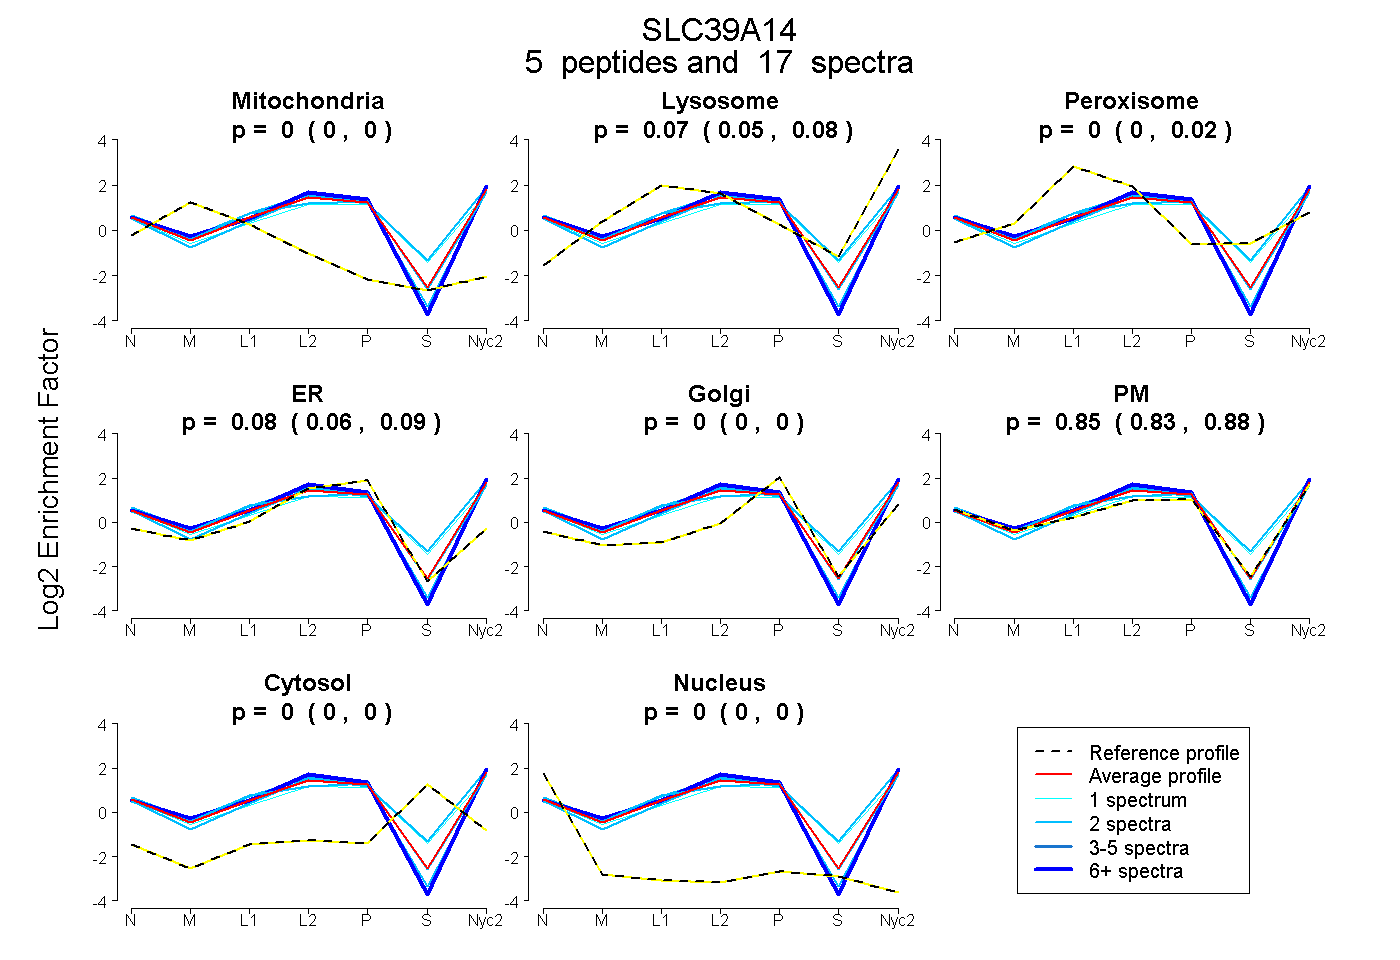
0.000 | 0.000
0.046 | 0.080
0.000 | 0.017
0.062 | 0.086
0.000 | 0.000
0.831 | 0.879
0.000 | 0.000
0.000 | 0.000
1peptide
spectra

0.000 | 0.000
0.000 | 0.000
0.379 | 0.477
0.000 | 0.000
0.381 | 0.508
0.000 | 0.000
0.101 | 0.131
4peptides
spectra
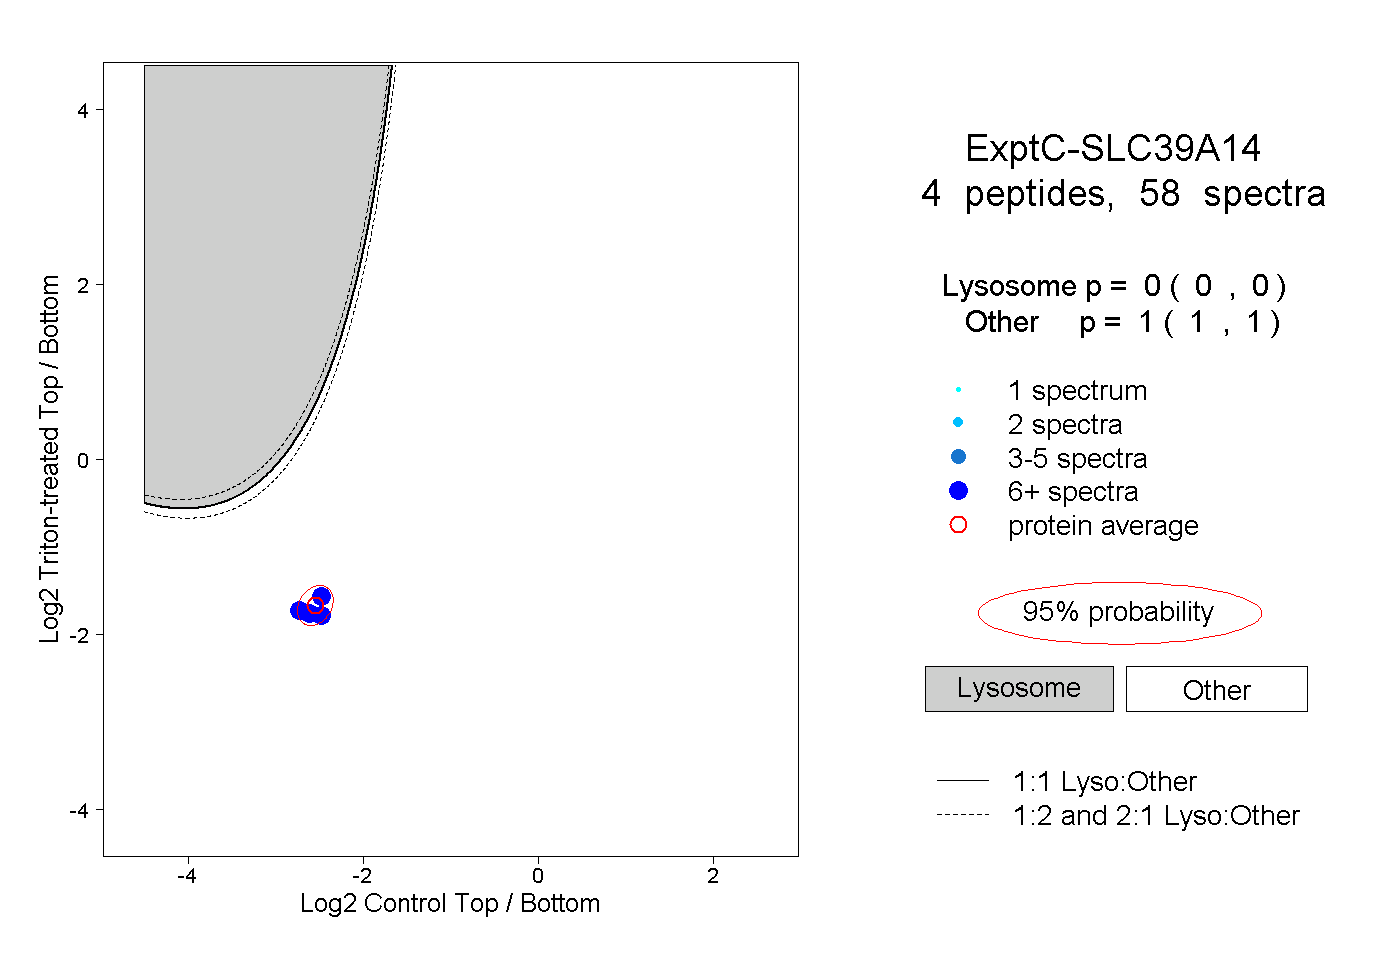
0.000 | 0.000
1.000 | 1.000
3peptides
spectra

0.000 | 0.003
0.997 | 1.000