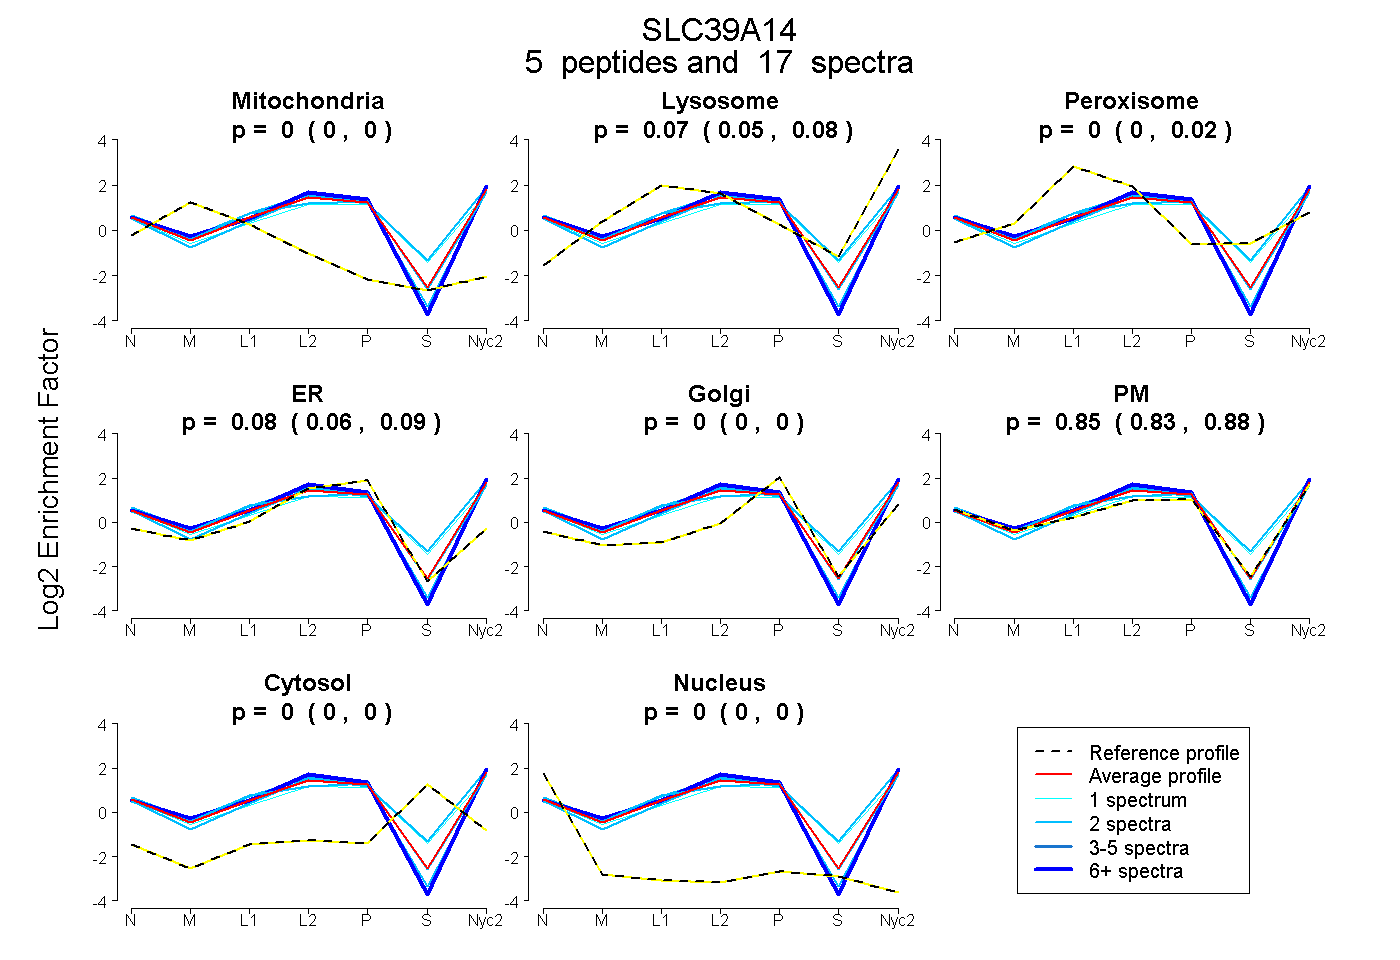
 5
5peptides
spectra
0.000 | 0.000
0.046 | 0.080
0.000 | 0.017
0.062 | 0.086
0.000 | 0.000
0.831 | 0.879
0.000 | 0.000
0.000 | 0.000
| Plot | Mito | Lyso | Perox | ER | Golgi | PM | Cytosol | Nucleus | |||||
| Expt A |
5 peptides |
17 spectra |
|
0.000 0.000 | 0.000 |
0.070 0.046 | 0.080 |
0.000 0.000 | 0.017 |
0.077 0.062 | 0.086 |
0.000 0.000 | 0.000 |
0.853 0.831 | 0.879 |
0.000 0.000 | 0.000 |
0.000 0.000 | 0.000 |
| 1 spectrum, ACTPENQENK | 0.000 | 0.036 | 0.078 | 0.001 | 0.000 | 0.812 | 0.073 | 0.000 | ||
| 2 spectra, APSTDEK | 0.000 | 0.120 | 0.053 | 0.010 | 0.000 | 0.763 | 0.054 | 0.000 | ||
| 2 spectra, SEFQEFCPTILQQLDSR | 0.000 | 0.005 | 0.000 | 0.075 | 0.000 | 0.920 | 0.000 | 0.000 | ||
| 10 spectra, TLLNSVGVGR | 0.000 | 0.000 | 0.000 | 0.056 | 0.000 | 0.944 | 0.000 | 0.000 | ||
| 2 spectra, YGENDSLTLPQLK | 0.000 | 0.060 | 0.023 | 0.086 | 0.000 | 0.831 | 0.000 | 0.000 |
| Plot | Mito | Lyso or Perox | ER | Golgi | PM | Cytosol | Nucleus | ||||||
| Expt B |
1 peptide |
9 spectra |
 |
0.000 0.000 | 0.000 |
0.000 0.000 | 0.000 |
0.432 0.379 | 0.477 |
0.000 0.000 | 0.000 |
0.451 0.381 | 0.508 |
0.000 0.000 | 0.000 |
0.117 0.101 | 0.131 |
|||
| Plot | Lyso | Other | |||||||||||
| Expt C |
4 peptides |
58 spectra |
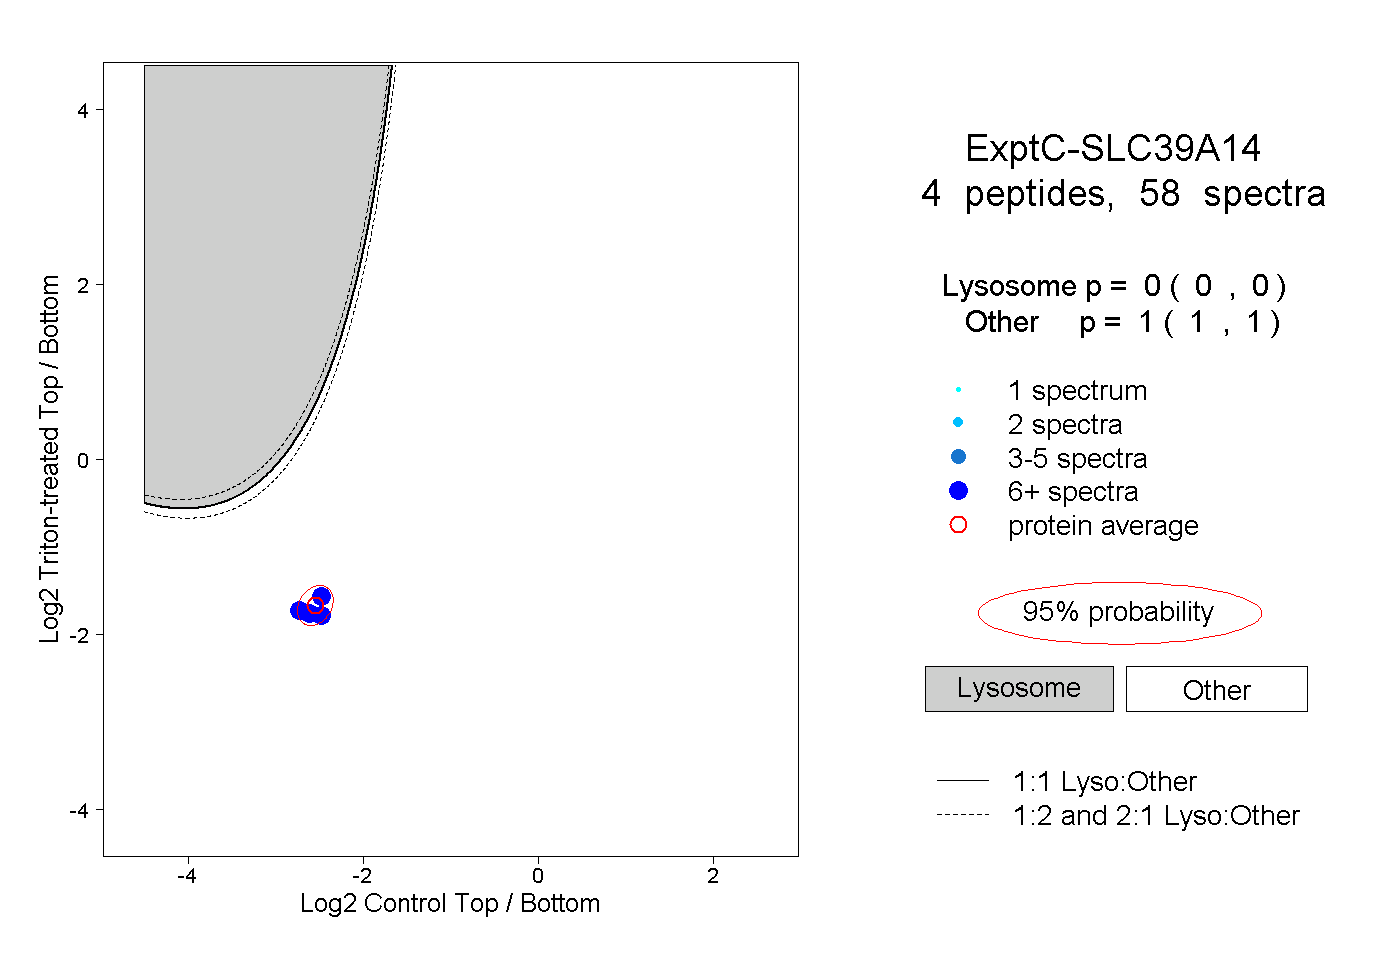 |
0.000 0.000 | 0.000 |
1.000 1.000 | 1.000 |
||||||||
| Plot | Lyso | Other | |||||||||||
| Expt D |
3 peptides |
5 spectra |
 |
0.000 0.000 | 0.003 |
1.000 0.997 | 1.000 |