 4
4peptides
spectra
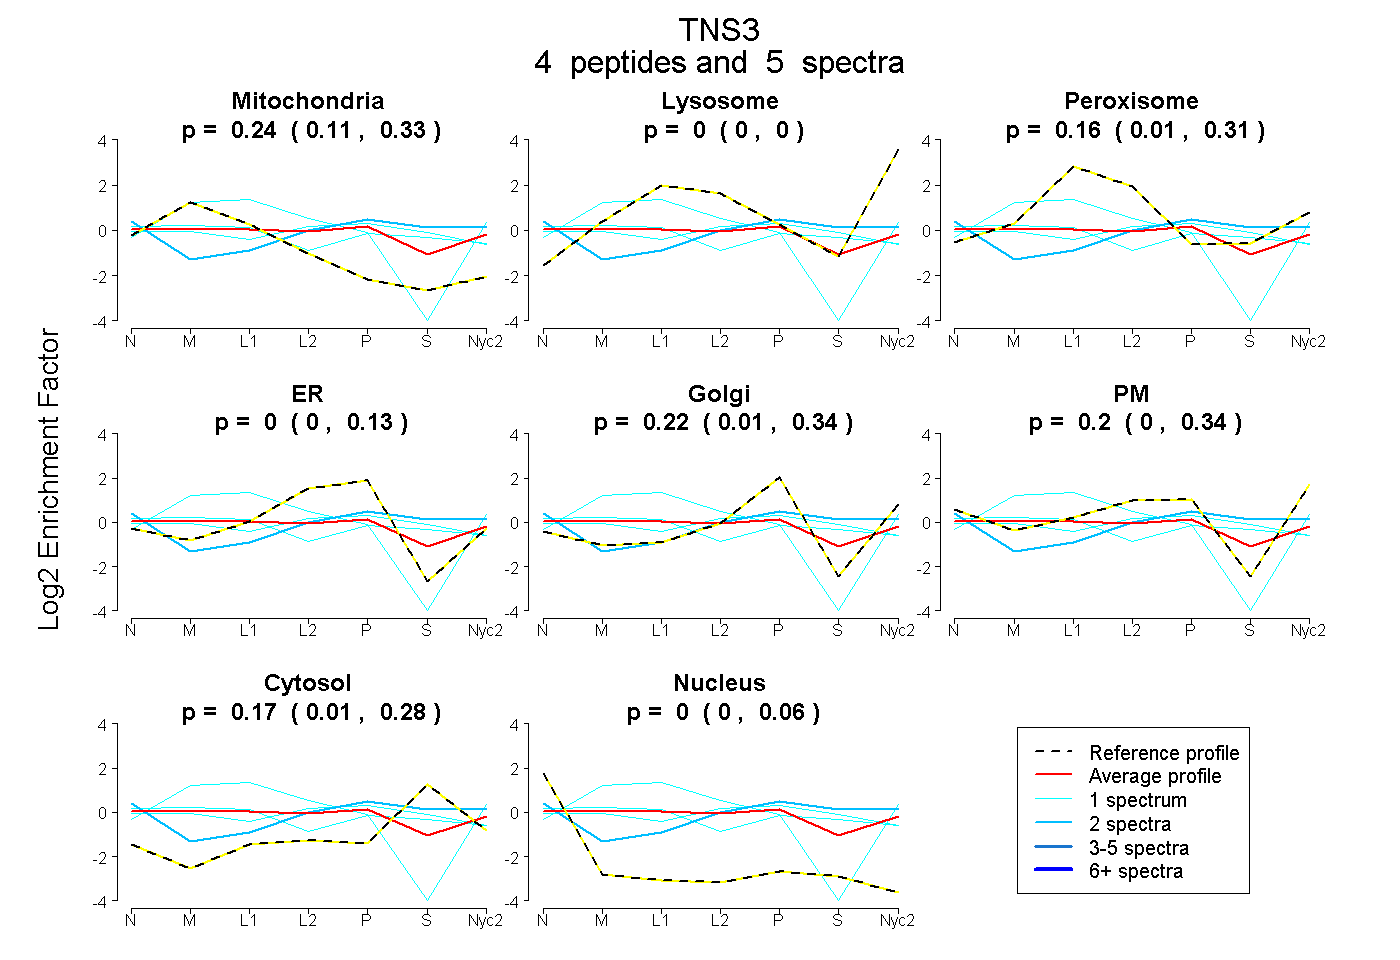
0.108 | 0.326
0.000 | 0.000
0.010 | 0.308
0.000 | 0.128
0.009 | 0.336
0.000 | 0.336
0.012 | 0.279
0.000 | 0.062
1peptide
spectra
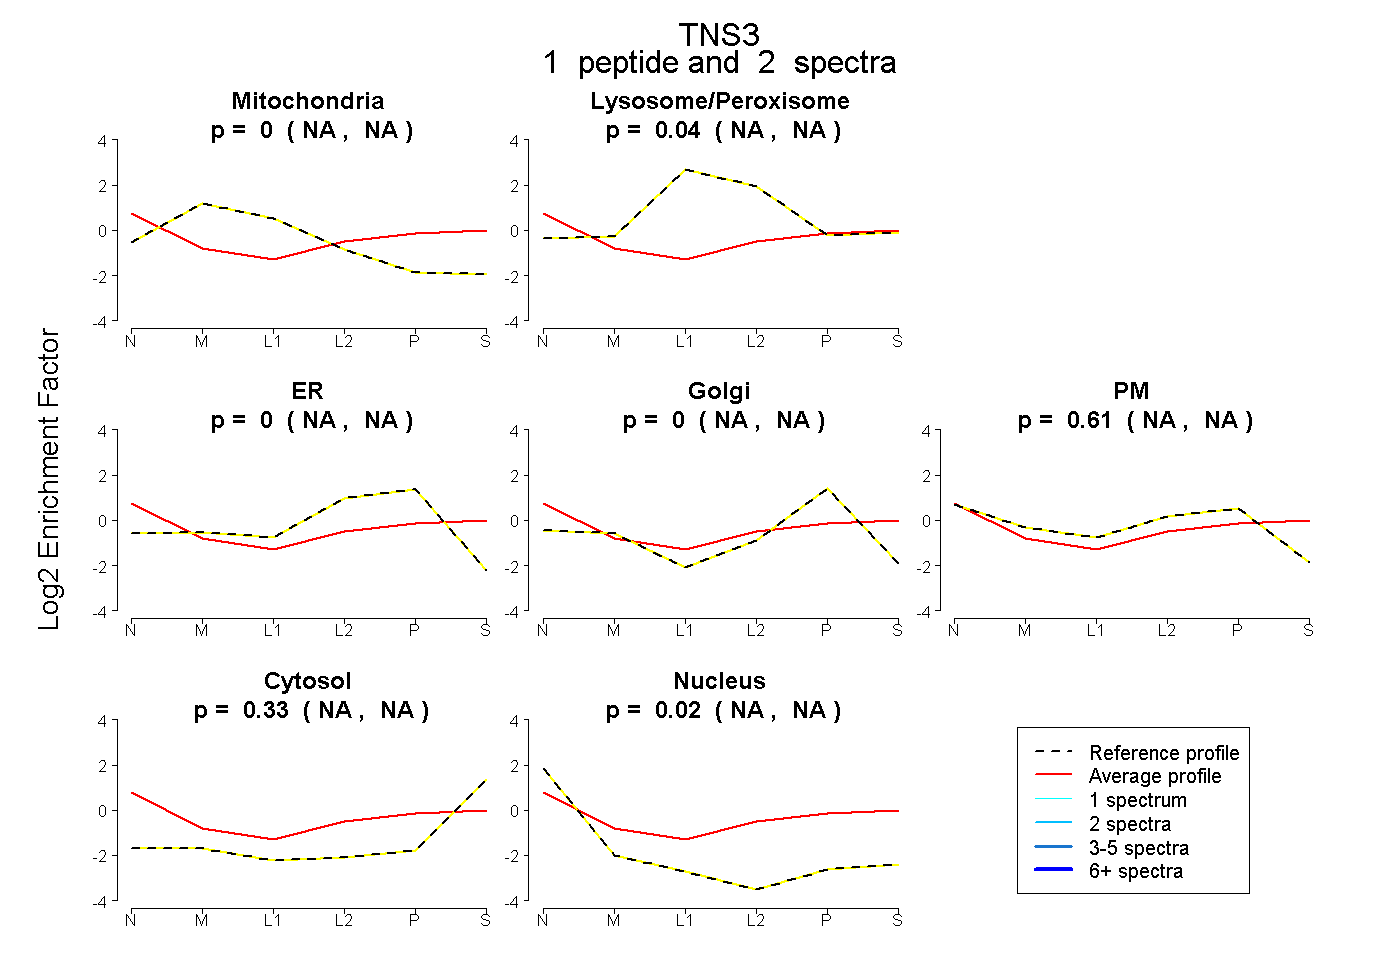
NA | NA
NA | NA
NA | NA
NA | NA
NA | NA
NA | NA
NA | NA
2peptides
spectra
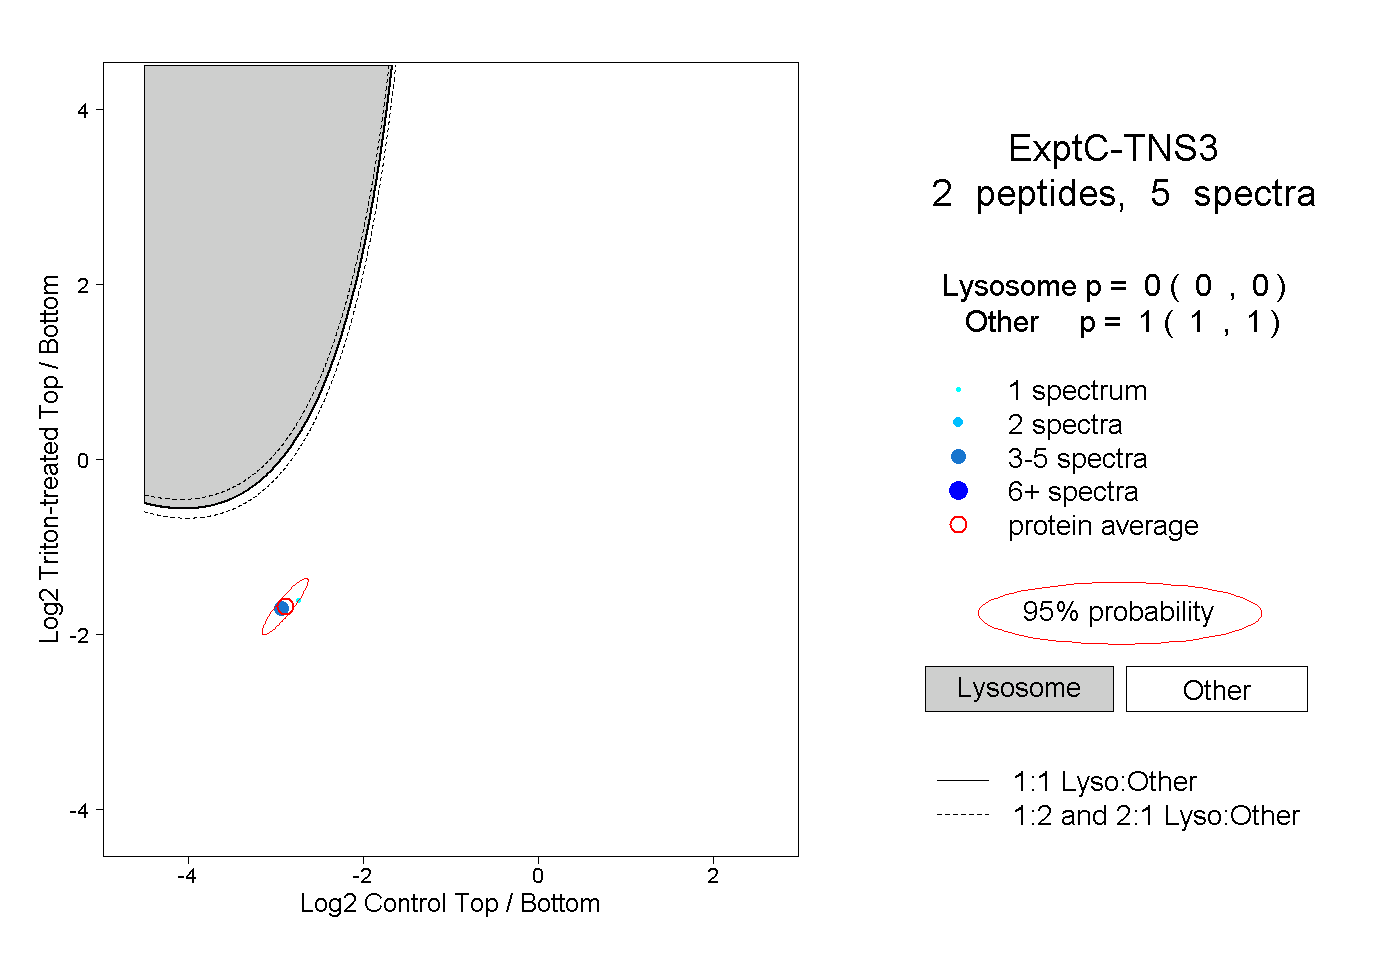
0.000 | 0.000
1.000 | 1.000
1peptide
spectra
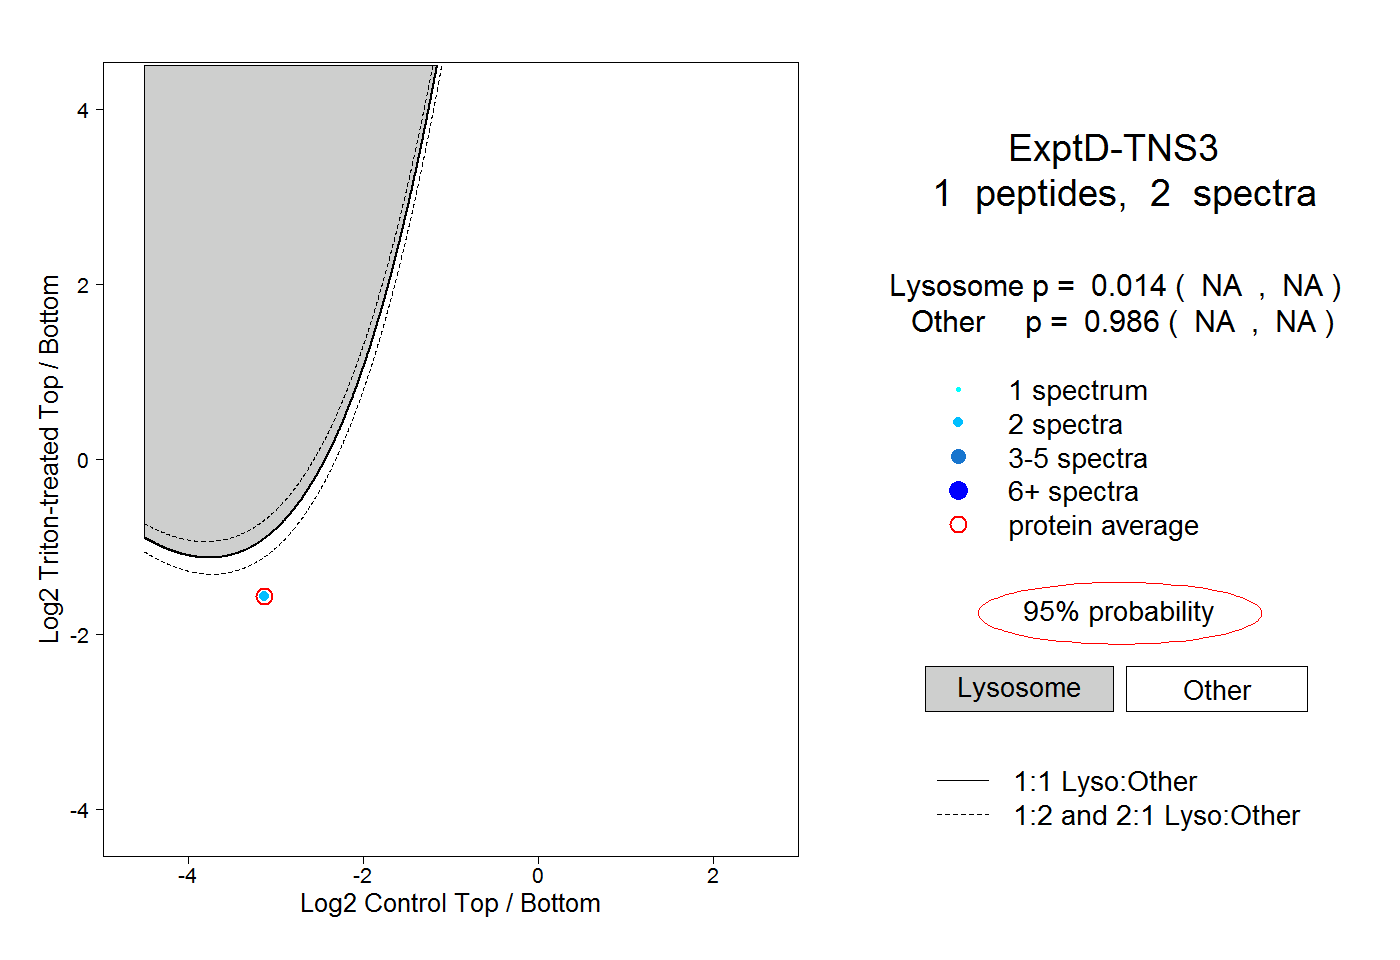
NA | NA
NA | NA