 4
4peptides
spectra
0.108 | 0.326
0.000 | 0.000
0.010 | 0.308
0.000 | 0.128
0.009 | 0.336
0.000 | 0.336
0.012 | 0.279
0.000 | 0.062
| Plot | Mito | Lyso | Perox | ER | Golgi | PM | Cytosol | Nucleus | |||||
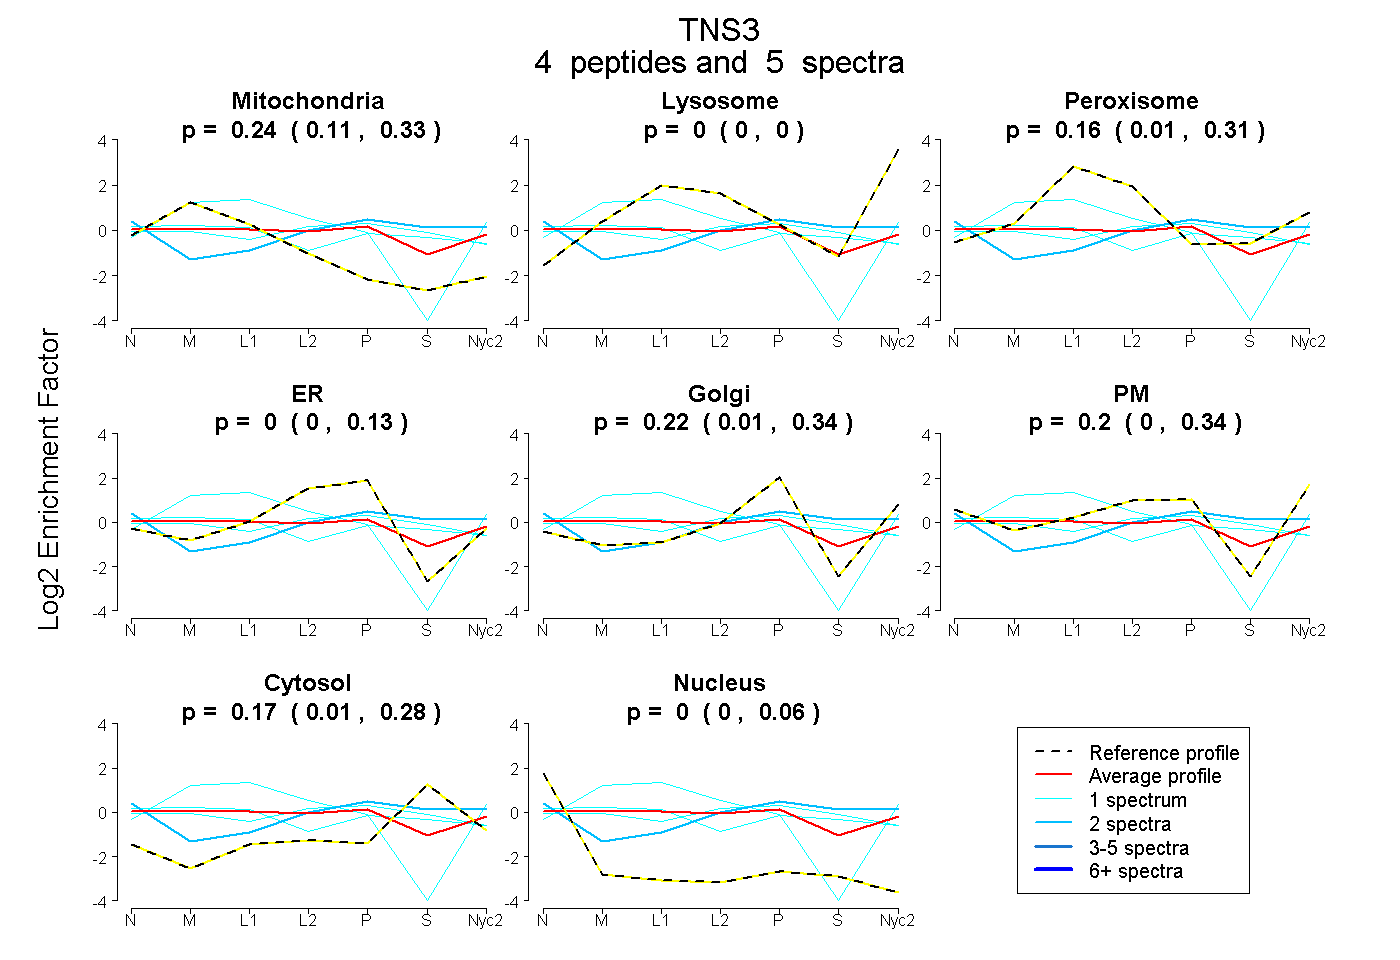
| Expt A |
4 peptides |
5 spectra |
|
0.239 0.108 | 0.326 |
0.000 0.000 | 0.000 |
0.164 0.010 | 0.308 |
0.000 0.000 | 0.128 |
0.224 0.009 | 0.336 |
0.200 0.000 | 0.336 |
0.172 0.012 | 0.279 |
0.000 0.000 | 0.062 |
| 2 spectra, VFGFVAR | 0.000 | 0.000 | 0.000 | 0.048 | 0.011 | 0.450 | 0.491 | 0.000 | ||
| 1 spectrum, EQAIAMLK | 0.307 | 0.000 | 0.164 | 0.000 | 0.164 | 0.079 | 0.285 | 0.000 | ||
| 1 spectrum, LLLEPR | 0.424 | 0.191 | 0.000 | 0.121 | 0.000 | 0.264 | 0.000 | 0.000 | ||
| 1 spectrum, HFLIECTPK | 0.138 | 0.000 | 0.143 | 0.235 | 0.039 | 0.095 | 0.350 | 0.000 |
| Plot | Mito | Lyso or Perox | ER | Golgi | PM | Cytosol | Nucleus | ||||||
| Expt B |
1 peptide |
2 spectra |
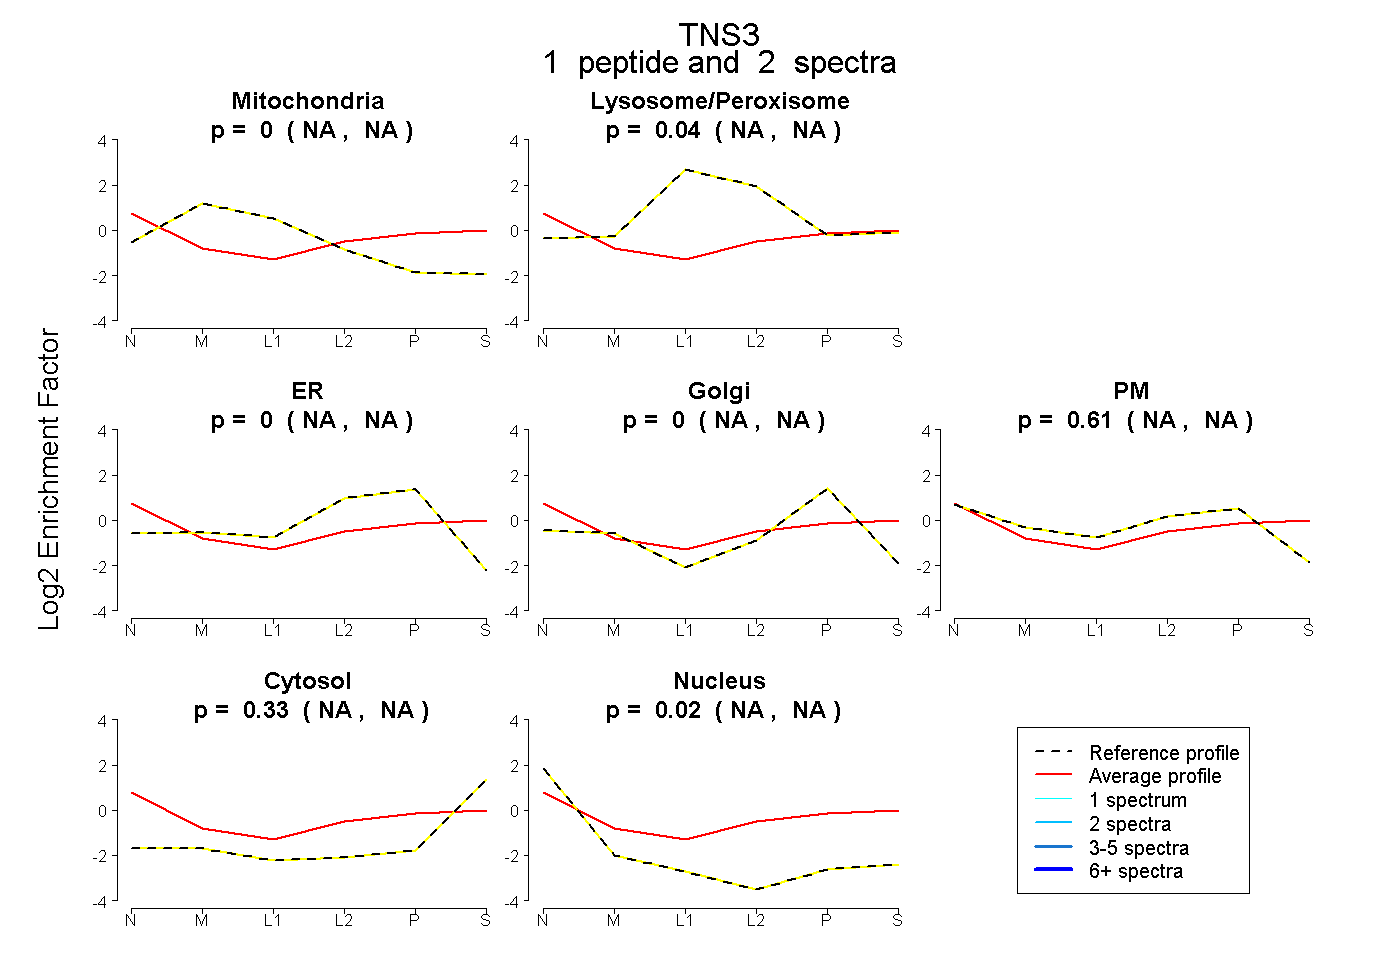 |
0.000 NA | NA |
0.040 NA | NA |
0.000 NA | NA |
0.000 NA | NA |
0.611 NA | NA |
0.327 NA | NA |
0.023 NA | NA |
|||
| Plot | Lyso | Other | |||||||||||
| Expt C |
2 peptides |
5 spectra |
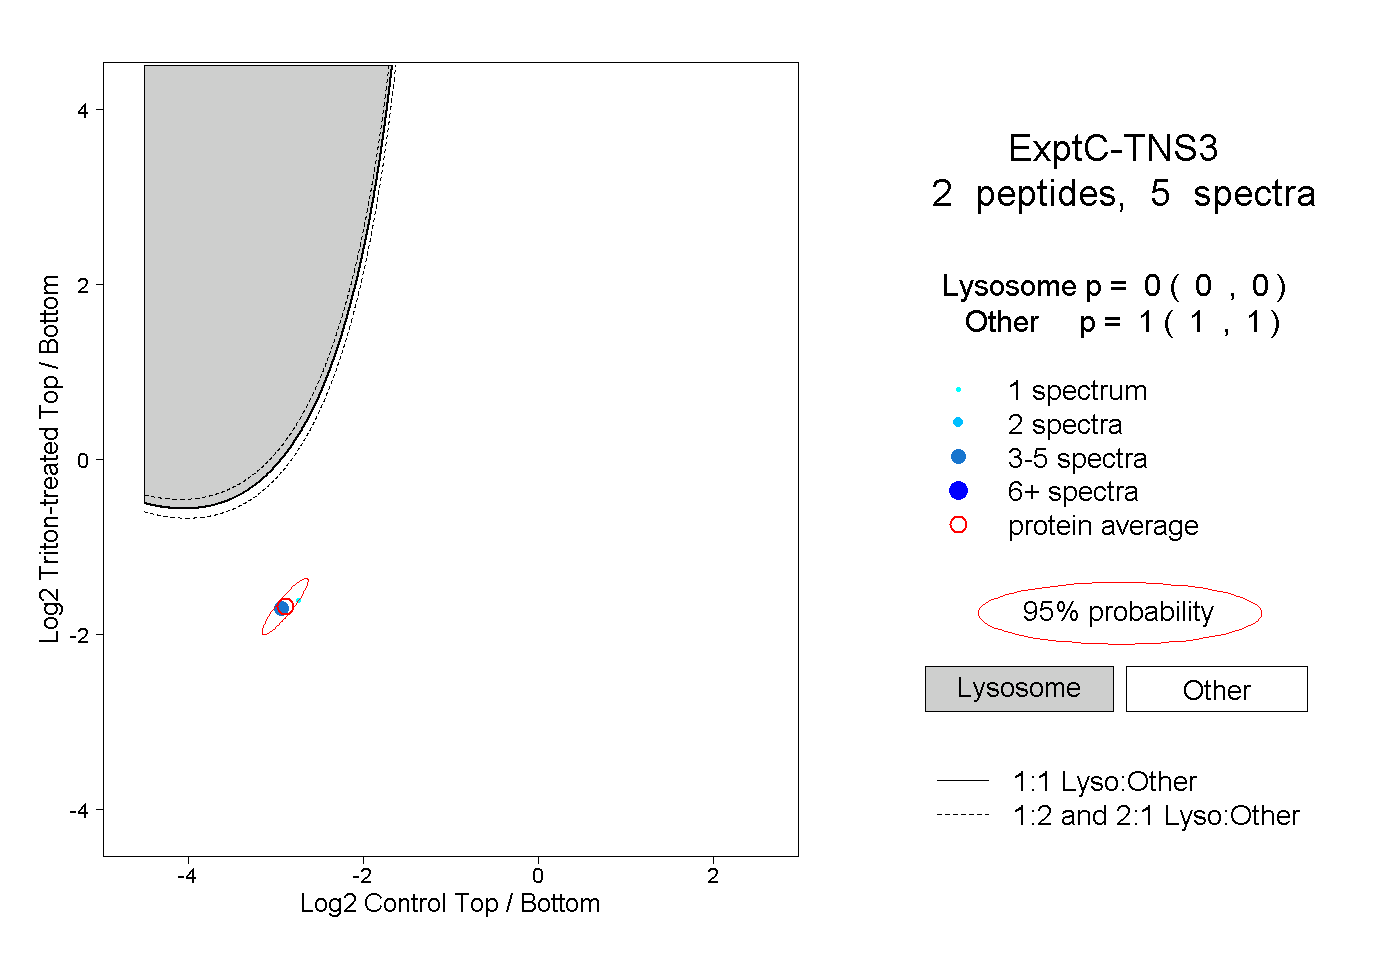 |
0.000 0.000 | 0.000 |
1.000 1.000 | 1.000 |
||||||||
| Plot | Lyso | Other | |||||||||||
| Expt D |
1 peptide |
2 spectra |
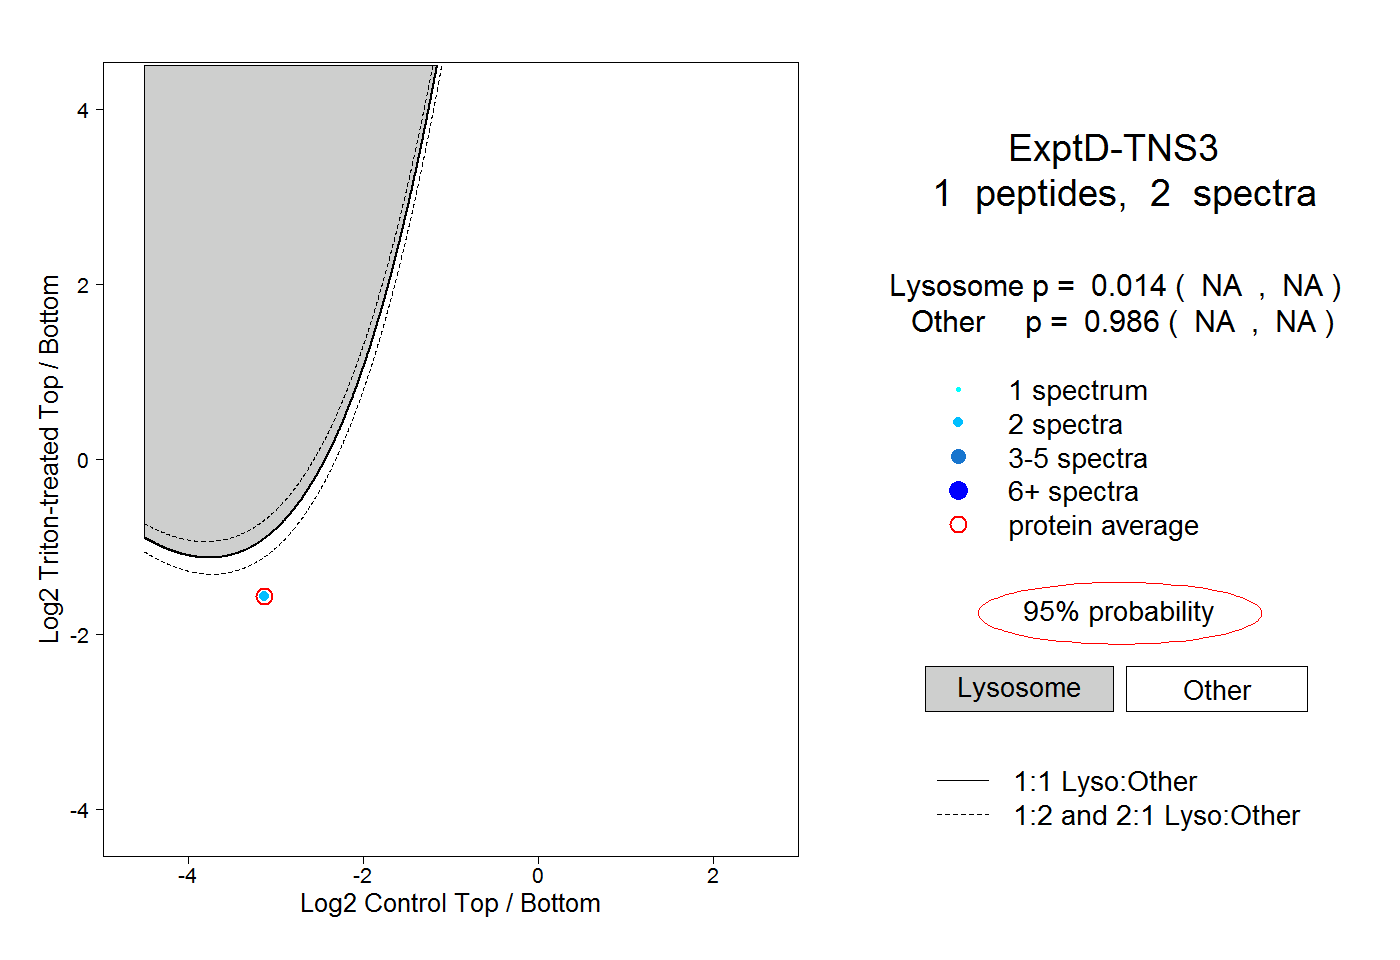 |
0.014 NA | NA |
0.986 NA | NA |