 5
5peptides
spectra
0.000 | 0.000
0.000 | 0.000
0.000 | 0.000
0.000 | 0.070
0.229 | 0.332
0.384 | 0.509
0.190 | 0.246
0.000 | 0.037
3peptides
spectra
0.000 | 0.000
1.000 | 1.000
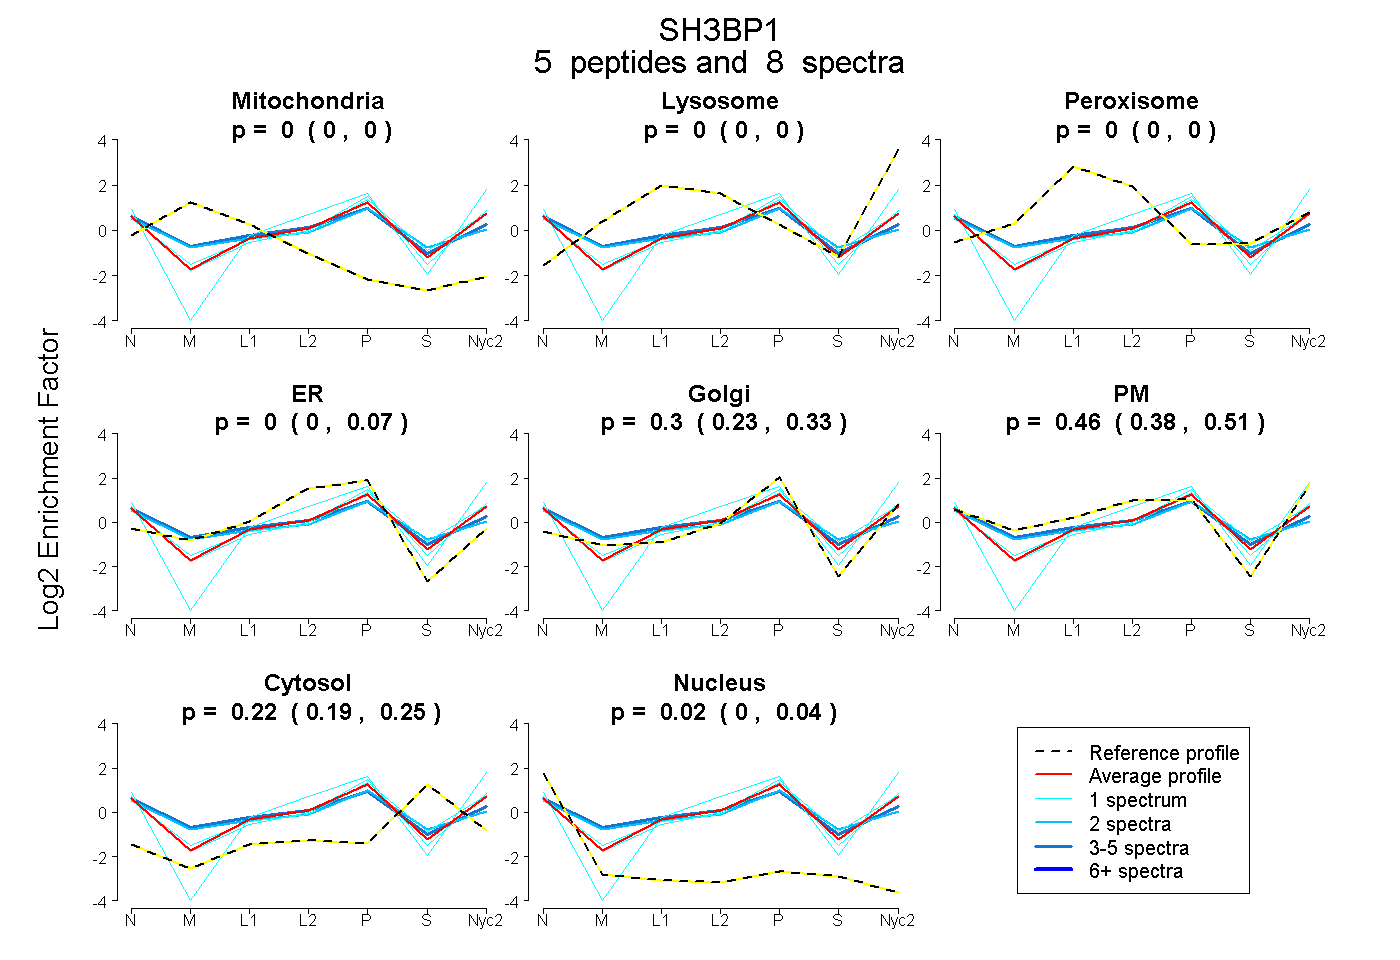
| Plot | Mito | Lyso | Perox | ER | Golgi | PM | Cytosol | Nucleus | |||||
| Expt A |
5 peptides |
8 spectra |
|
0.000 0.000 | 0.000 |
0.000 0.000 | 0.000 |
0.000 0.000 | 0.000 |
0.002 0.000 | 0.070 |
0.299 0.229 | 0.332 |
0.461 0.384 | 0.509 |
0.219 0.190 | 0.246 |
0.019 0.000 | 0.037 |
||
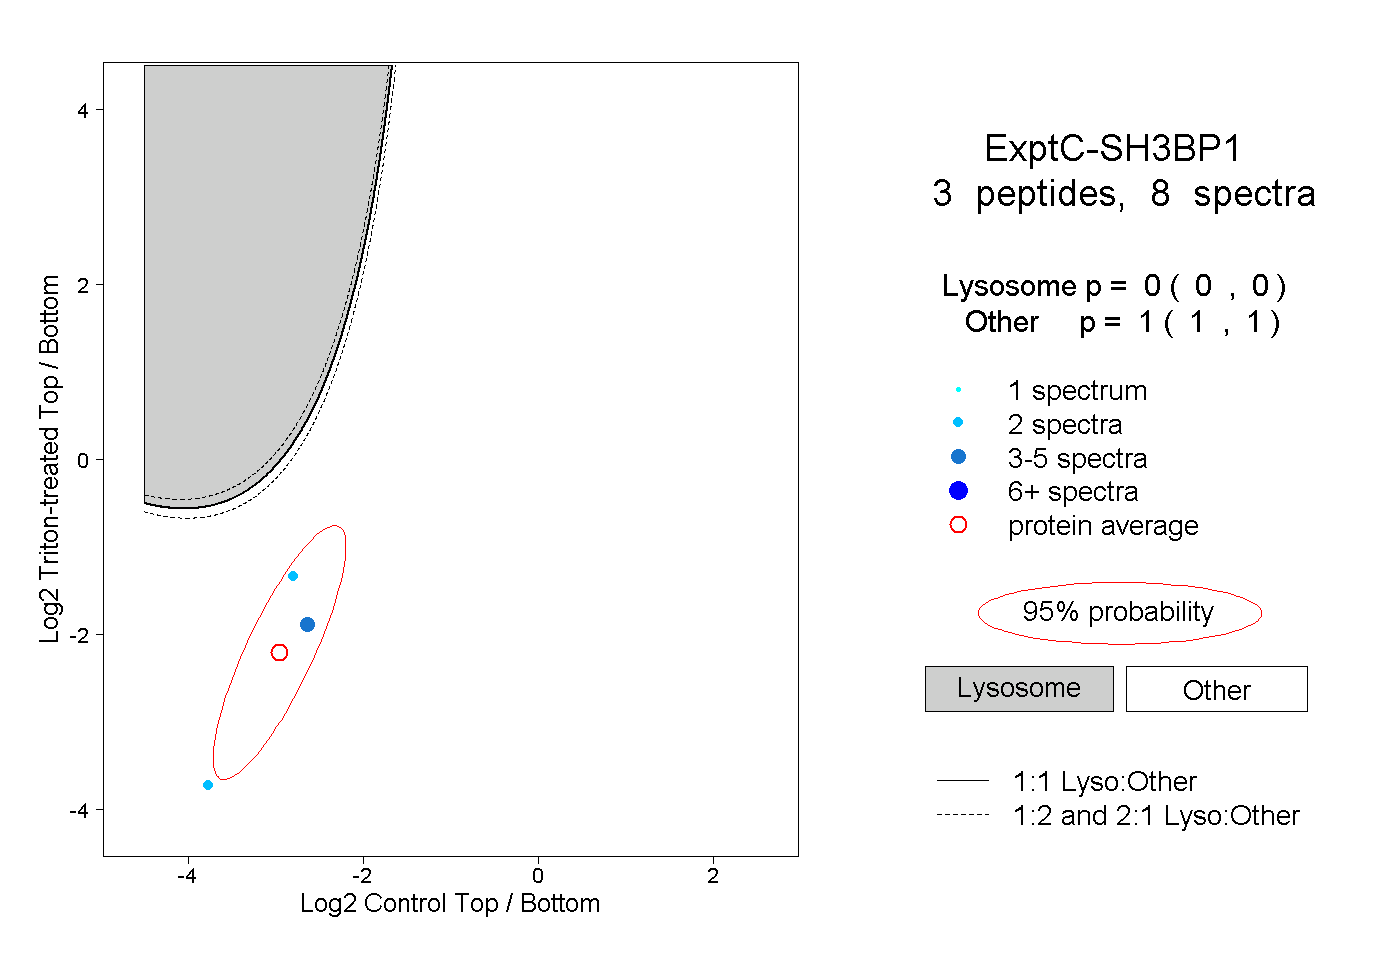
| Plot | Lyso | Other | |||||||||||
| Expt C |
3 peptides |
8 spectra |
|
0.000 0.000 | 0.000 |
1.000 1.000 | 1.000 |