 5
5peptides
spectra
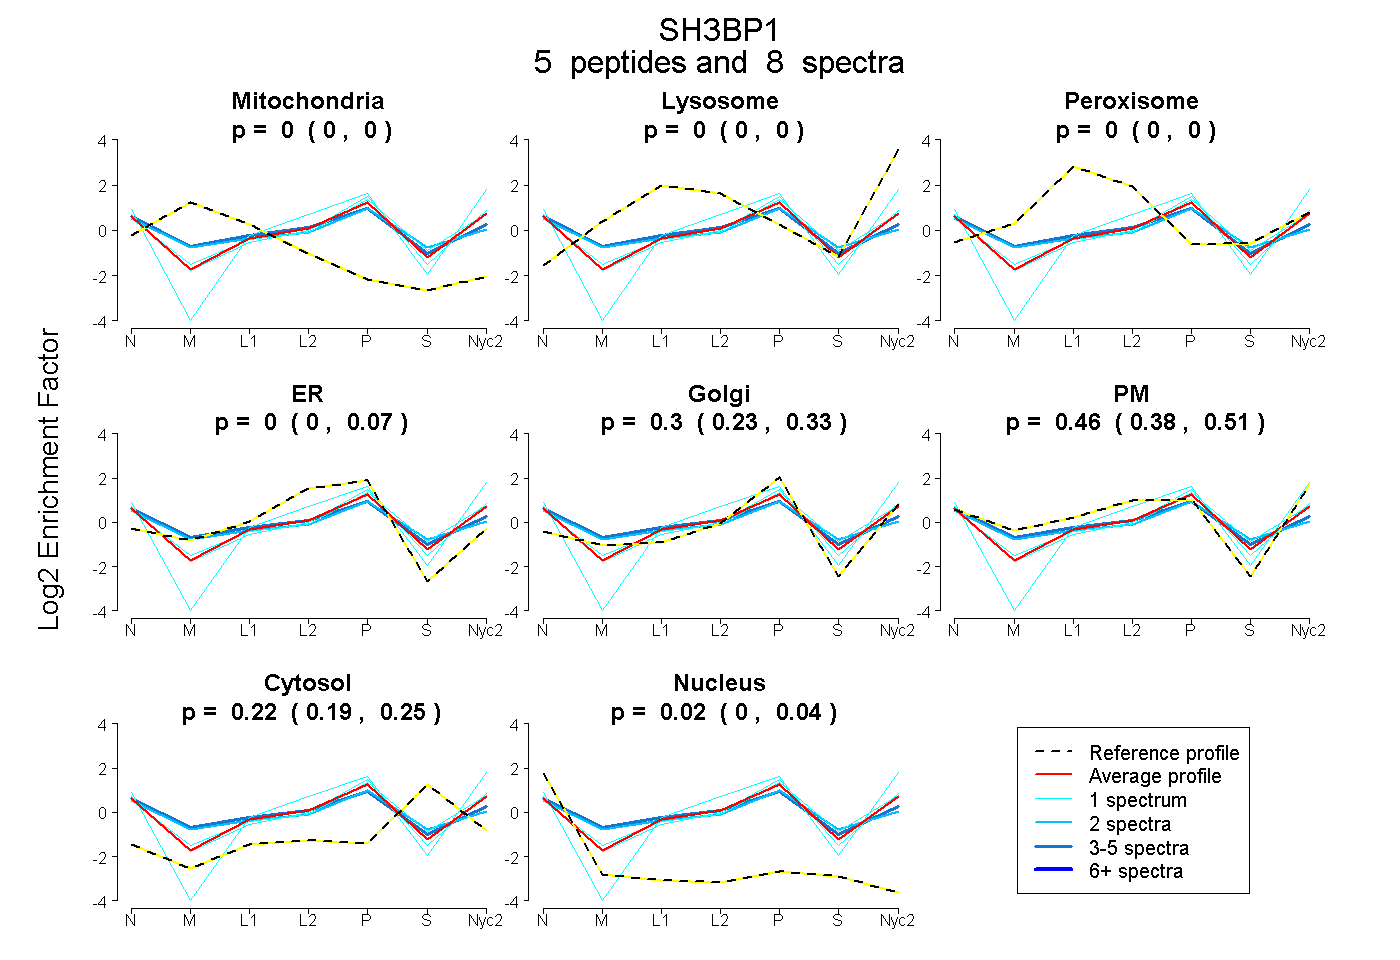
0.000 | 0.000
0.000 | 0.000
0.000 | 0.000
0.000 | 0.070
0.229 | 0.332
0.384 | 0.509
0.190 | 0.246
0.000 | 0.037
| Plot | Mito | Lyso | Perox | ER | Golgi | PM | Cytosol | Nucleus | |||||
| Expt A |
5 peptides |
8 spectra |
|
0.000 0.000 | 0.000 |
0.000 0.000 | 0.000 |
0.000 0.000 | 0.000 |
0.002 0.000 | 0.070 |
0.299 0.229 | 0.332 |
0.461 0.384 | 0.509 |
0.219 0.190 | 0.246 |
0.019 0.000 | 0.037 |
| 1 spectrum, LPQENFNNLR | 0.000 | 0.000 | 0.000 | 0.000 | 0.333 | 0.410 | 0.257 | 0.000 | ||
| 2 spectra, LEALHDVCSR | 0.000 | 0.000 | 0.074 | 0.089 | 0.210 | 0.329 | 0.243 | 0.055 | ||
| 1 spectrum, FLALLAEEQDVNK | 0.000 | 0.000 | 0.000 | 0.000 | 0.437 | 0.437 | 0.126 | 0.000 | ||
| 3 spectra, AAHNVHK | 0.000 | 0.000 | 0.069 | 0.103 | 0.123 | 0.448 | 0.205 | 0.052 | ||
| 1 spectrum, LSEEELPAILK | 0.000 | 0.000 | 0.000 | 0.000 | 0.454 | 0.368 | 0.142 | 0.036 |
| Plot | Lyso | Other | |||||||||||
| Expt C |
3 peptides |
8 spectra |
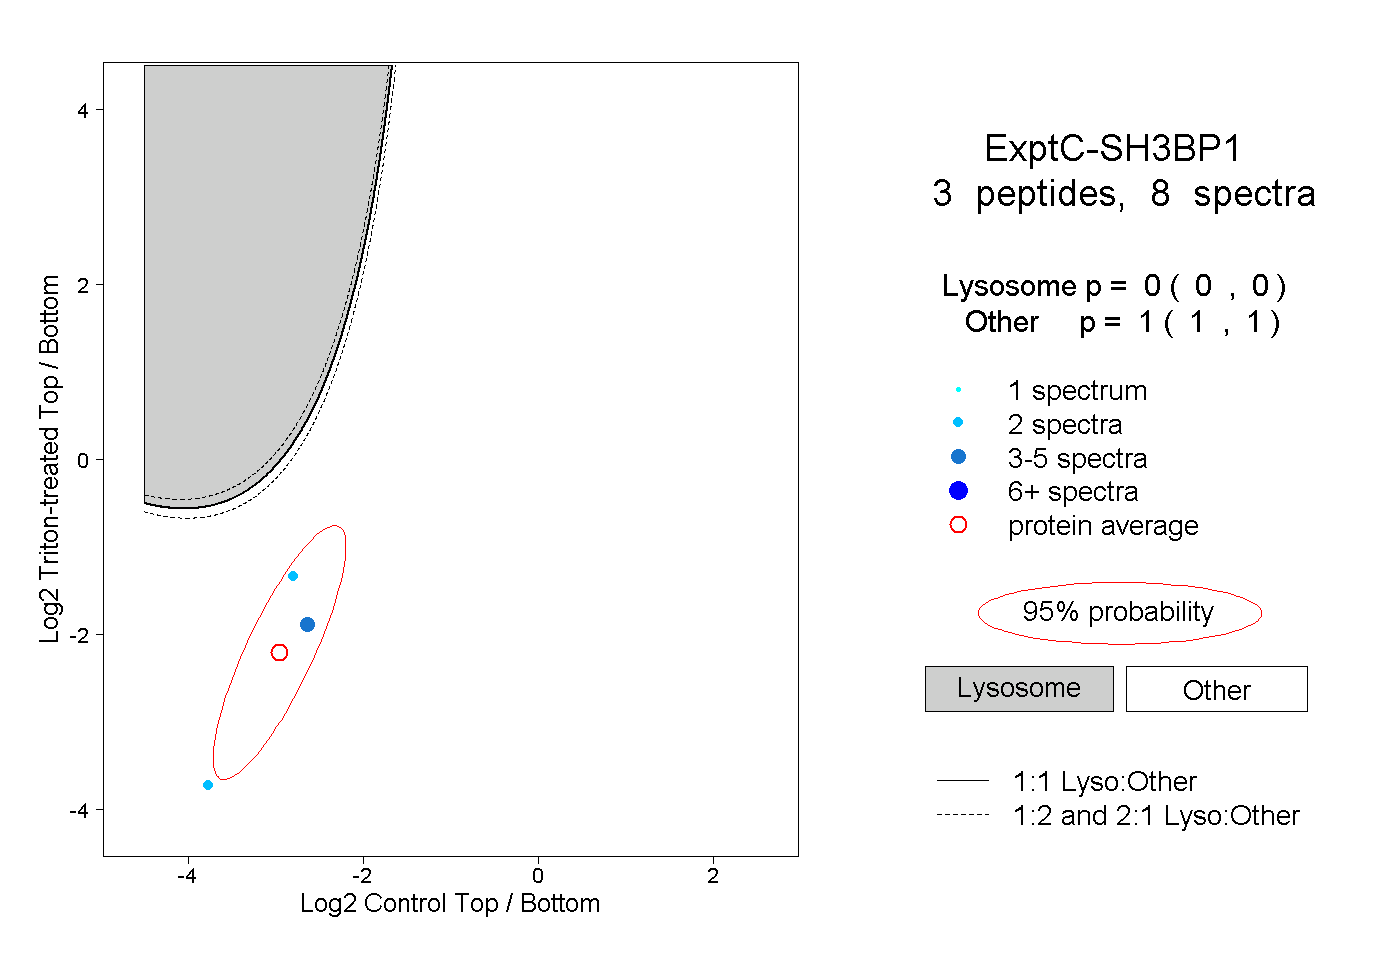 |
0.000 0.000 | 0.000 |
1.000 1.000 | 1.000 |