 10
10peptides
spectra
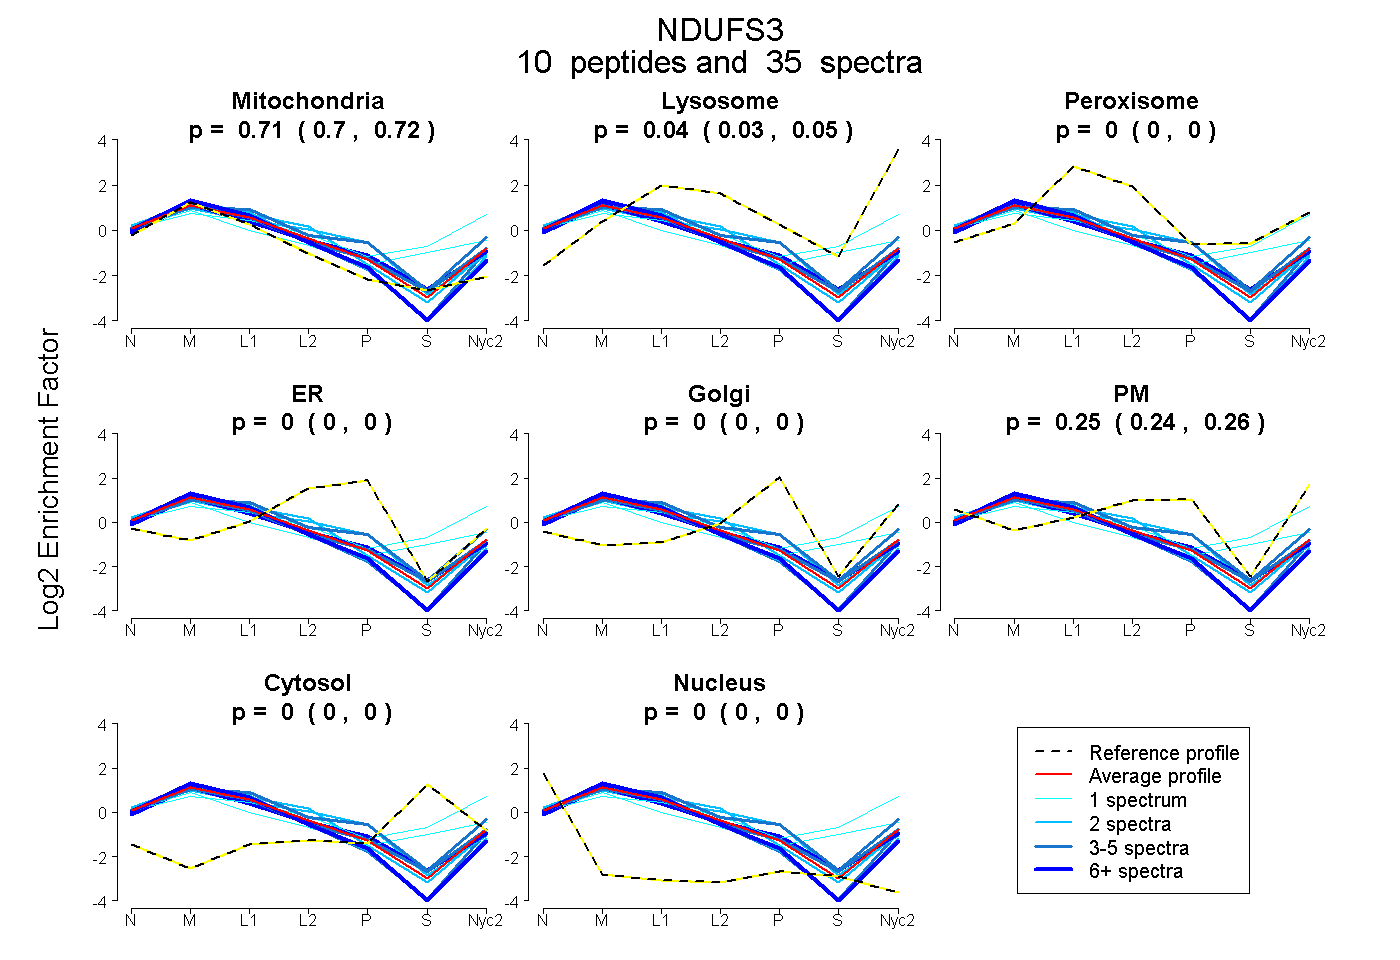
0.702 | 0.717
0.027 | 0.049
0.000 | 0.000
0.000 | 0.000
0.000 | 0.000
0.237 | 0.262
0.000 | 0.000
0.000 | 0.000
11peptides
spectra
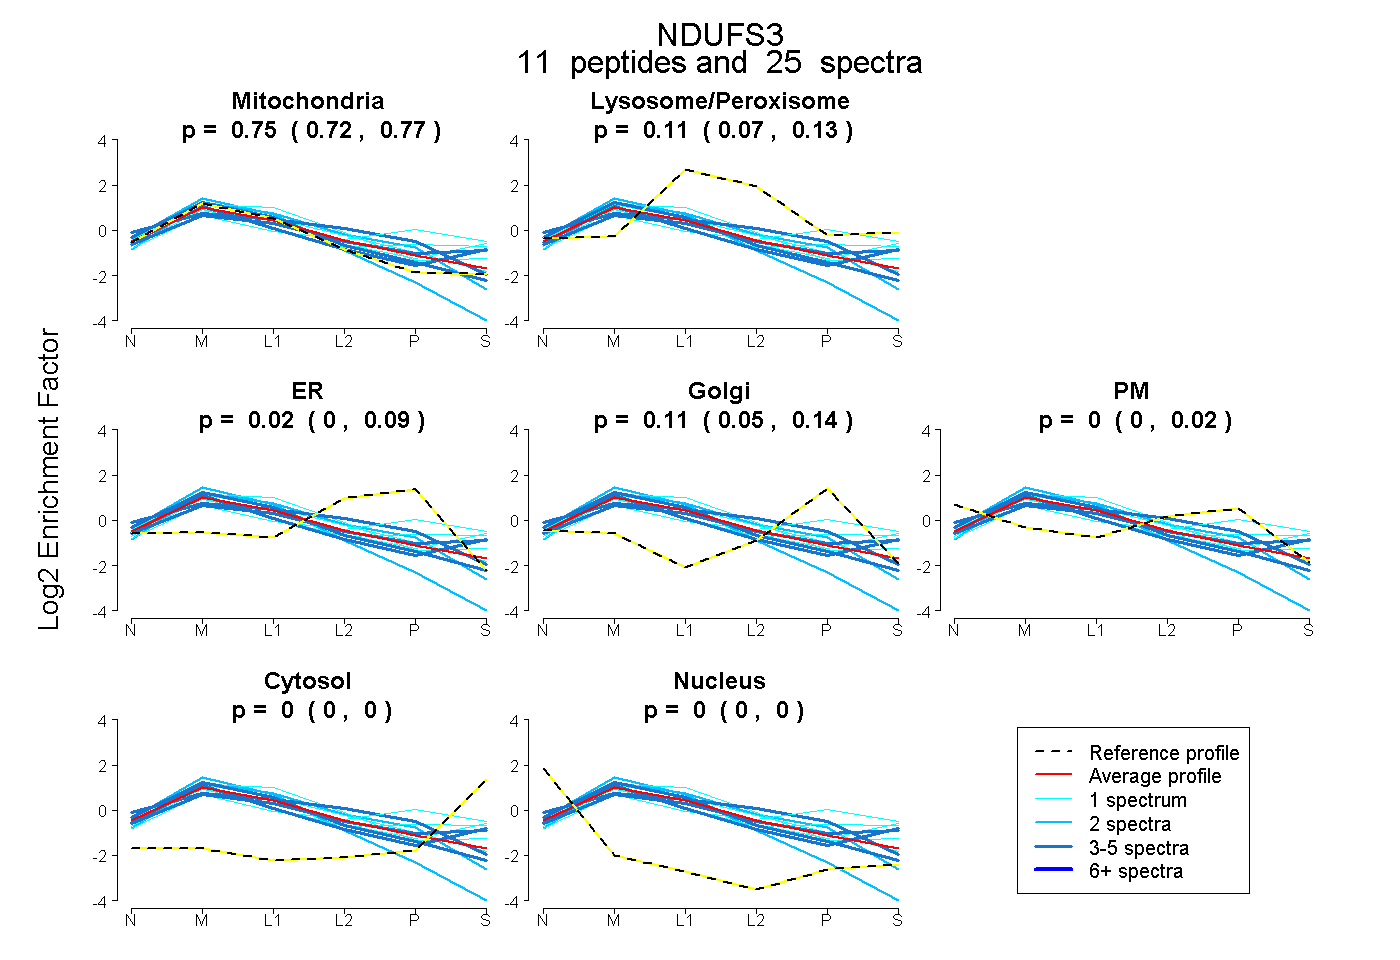
0.725 | 0.770
0.068 | 0.134
0.000 | 0.087
0.048 | 0.138
0.000 | 0.022
0.000 | 0.000
0.000 | 0.000
12peptides
spectra

0.000 | 0.000
1.000 | 1.000
7peptides
spectra

0.000 | 0.002
0.998 | 1.000