| 1 spectrum, EVWDMFGVFFFNHPDLR |
0.735 |
|
0.259 |
|
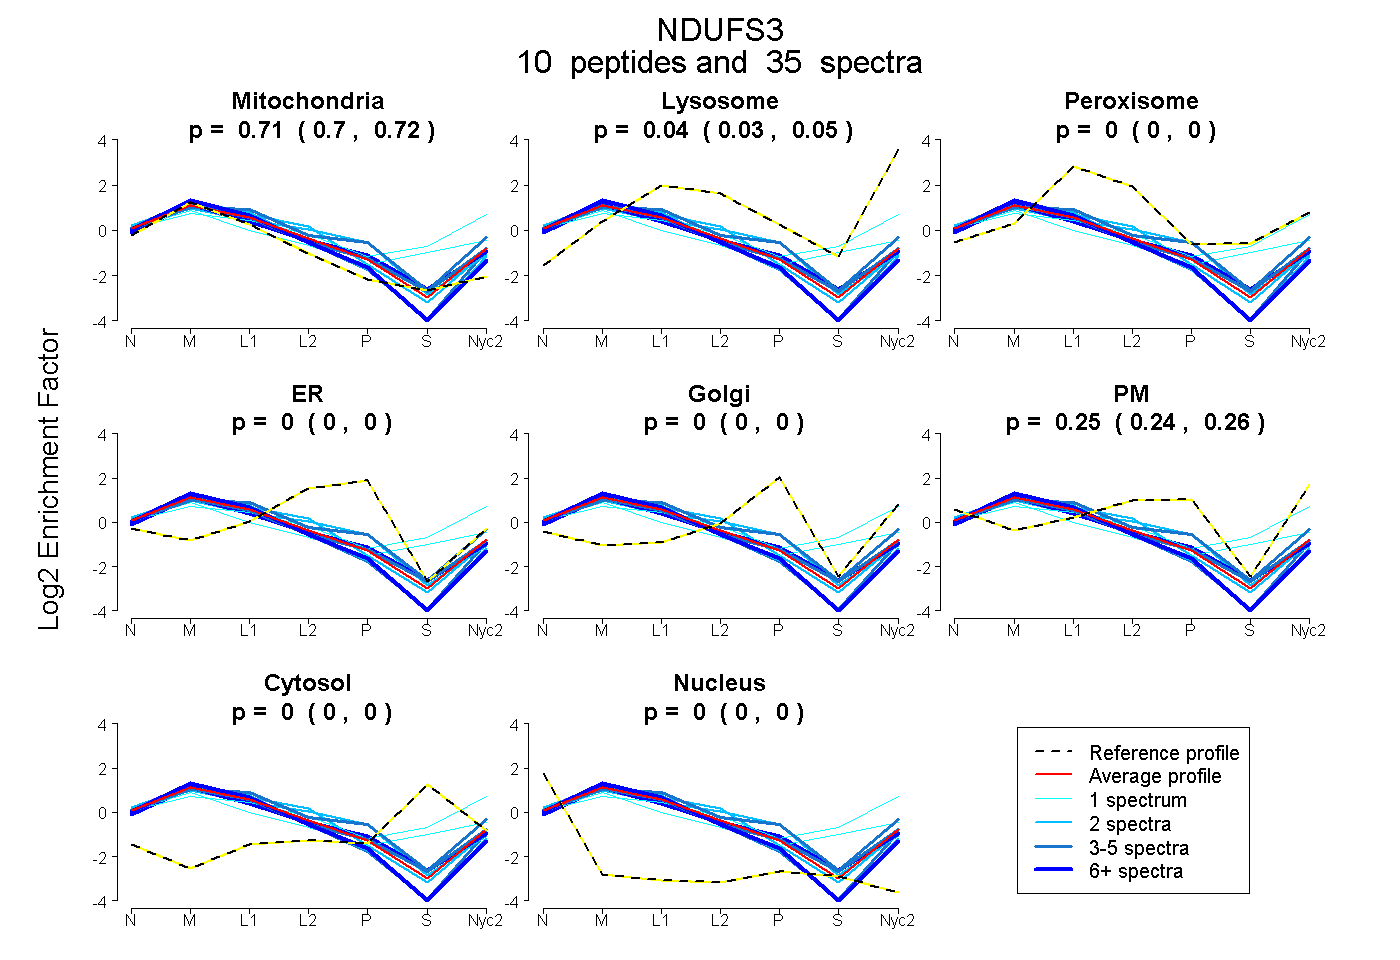
0.000 |
0.004 |
0.000 |
0.002 |
0.000 |
|
| 2 spectra, DHTNAQFK |
0.741 |
|
0.023 |
|
0.236 |
0.000 |
0.000 |
0.000 |
0.000 |
|
| 2 spectra, DFPLTGYVELR |
0.985 |
|
0.000 |
|
0.000 |
0.000 |
0.000 |
0.000 |
0.015 |
|
| 5 spectra, QPPEHLK |
0.885 |
|
0.000 |
|
0.044 |
0.000 |
0.071 |
0.000 |
0.000 |
|
| 1 spectrum, ESAAADK |
0.718 |
|
0.094 |
|
0.100 |
0.000 |
0.088 |
0.000 |
0.000 |
|
| 5 spectra, ILTDYGFEGHPFR |
0.510 |
|
0.121 |
|
0.156 |
0.000 |
0.213 |
0.000 |
0.000 |
|
| 1 spectrum, LEAGDK |
0.622 |
|
0.203 |
|
0.000 |
0.000 |
0.016 |
0.159 |
0.000 |
|
| 1 spectrum, FDLNSPWEAFPAYR |
0.527 |
|
0.167 |
|
0.000 |
0.173 |
0.000 |
0.133 |
0.000 |
|
| 3 spectra, SLADLTAVDVPTR |
0.747 |
|
0.071 |
|
0.000 |
0.000 |
0.004 |
0.178 |
0.000 |
|
| 1 spectrum, LSAFGEYVAEILPK |
0.296 |
|
0.270 |
|
0.000 |
0.308 |
0.000 |
0.126 |
0.000 |
|
| 3 spectra, VVAEPVELAQEFR |
0.566 |
|
0.201 |
|
0.000 |
0.106 |
0.000 |
0.126 |
0.000 |
|
 10
10