 4
4peptides
spectra
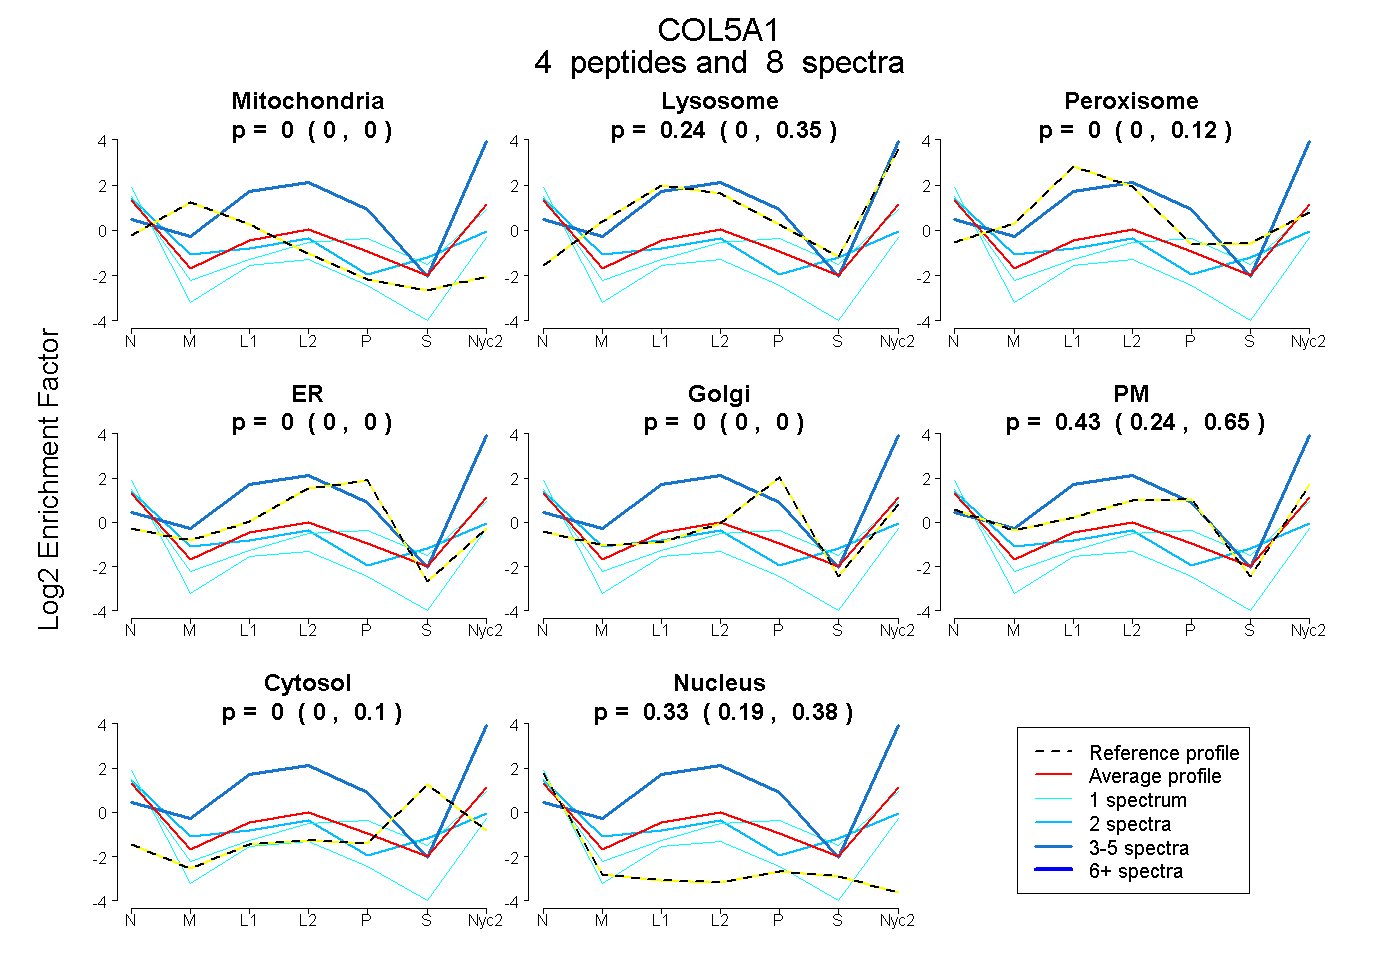
0.000 | 0.000
0.000 | 0.347
0.000 | 0.115
0.000 | 0.000
0.000 | 0.000
0.239 | 0.646
0.000 | 0.098
0.194 | 0.384
2peptides
spectra
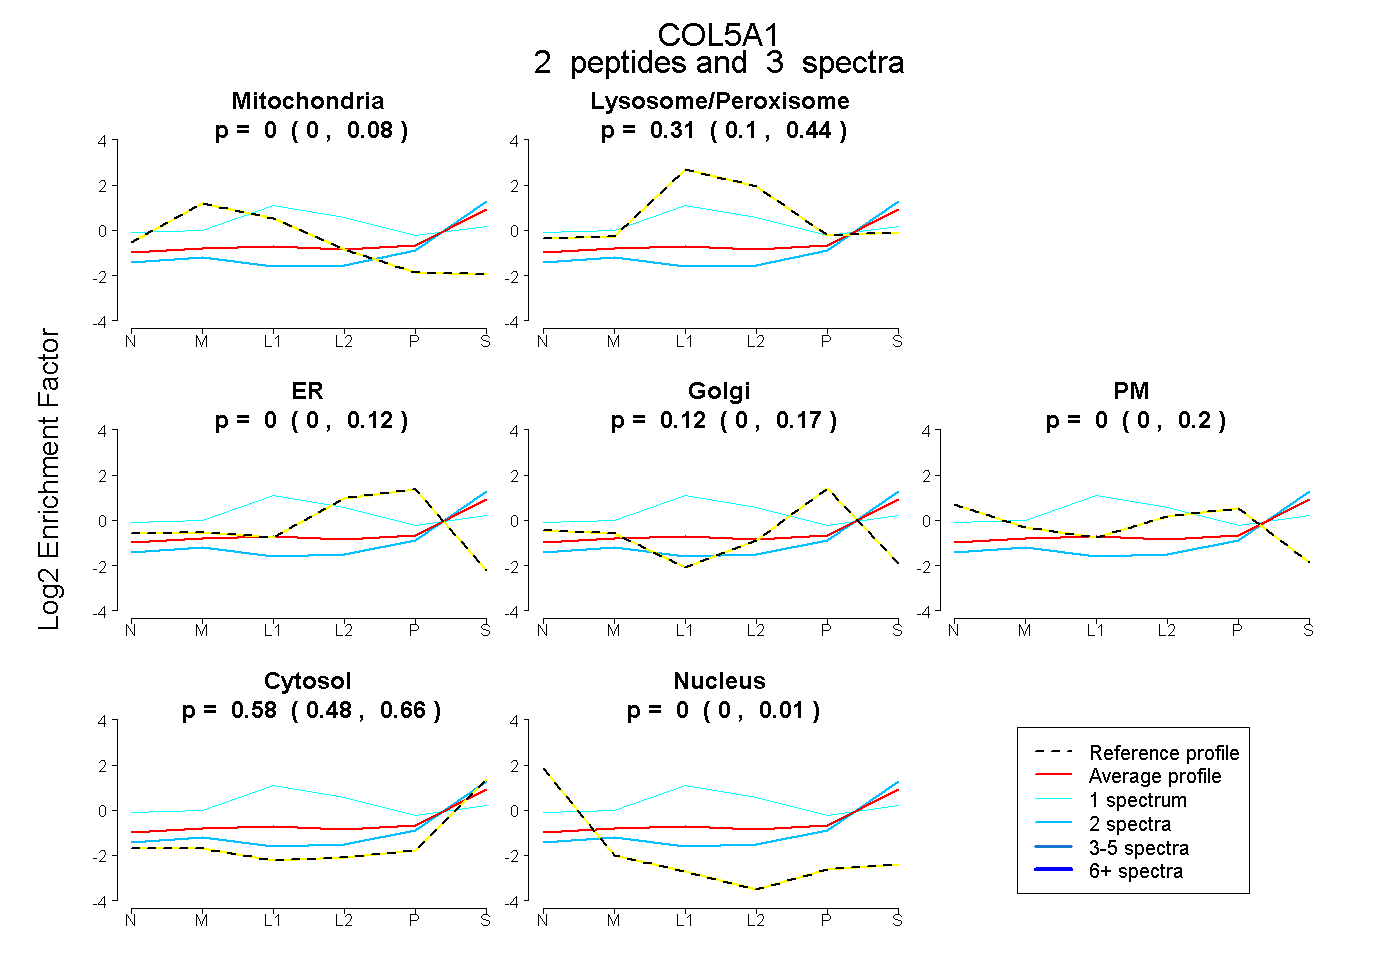
0.000 | 0.077
0.098 | 0.435
0.000 | 0.117
0.000 | 0.174
0.000 | 0.197
0.477 | 0.665
0.000 | 0.008
8peptides
spectra
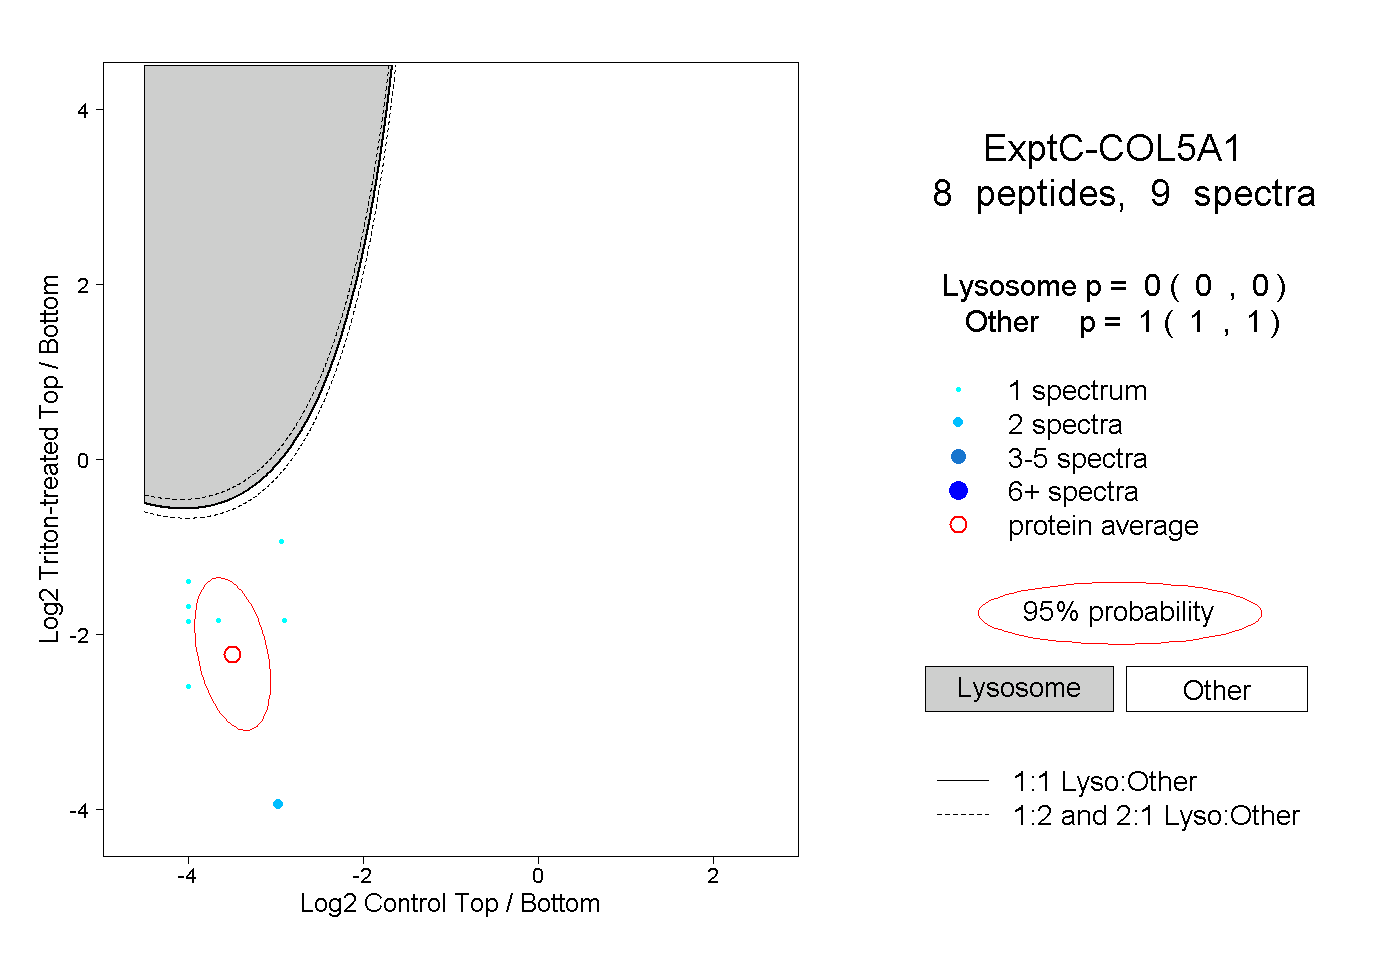
0.000 | 0.000
1.000 | 1.000
2peptides
spectra
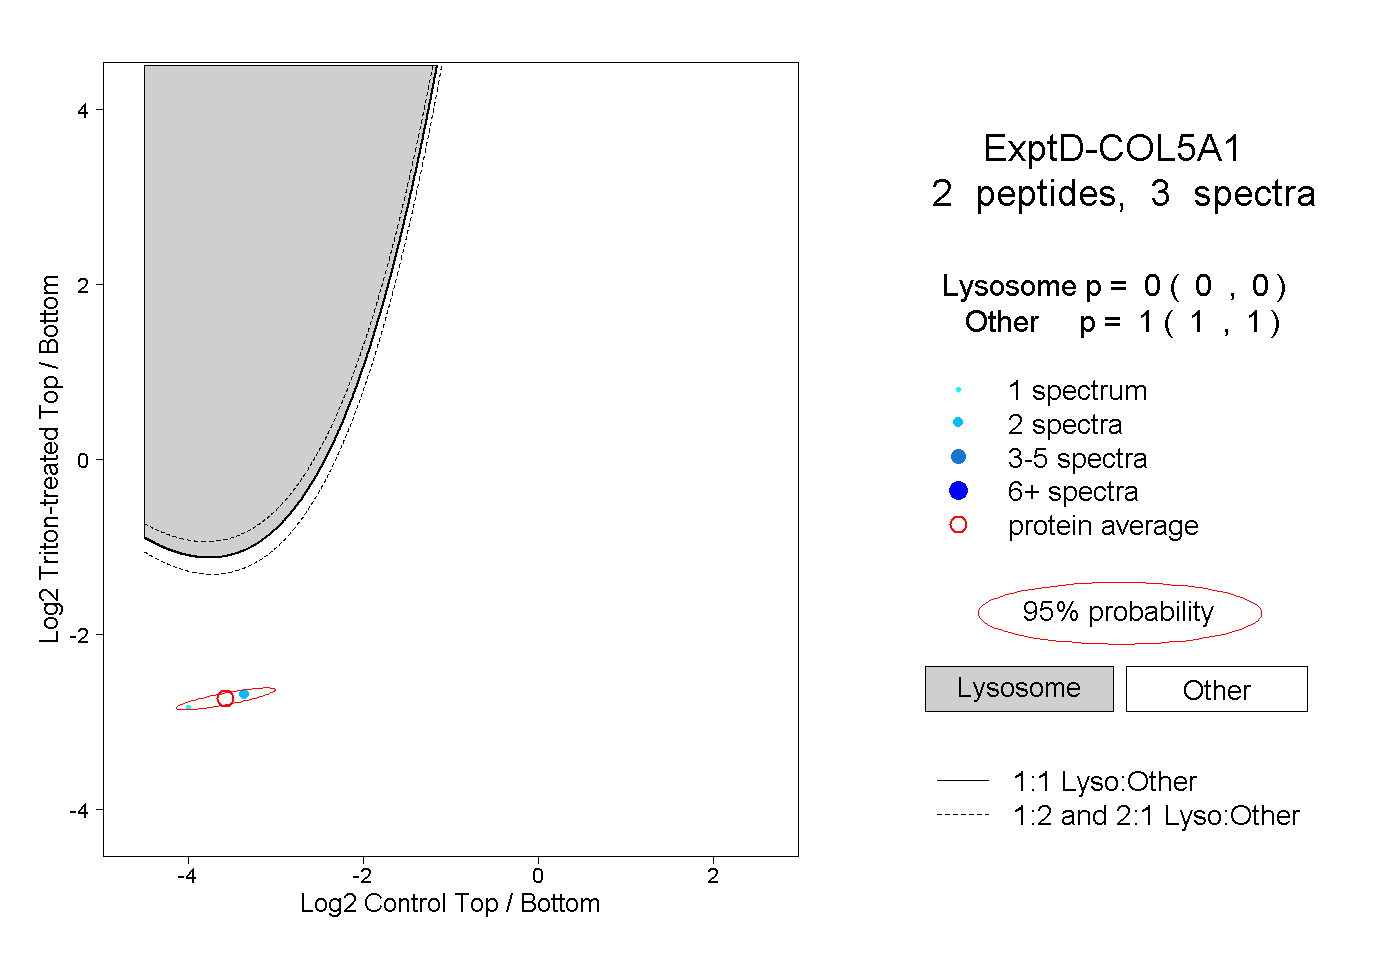
0.000 | 0.000
1.000 | 1.000